Drug Information
General Information of This Drug
| Drug ID | DRG00064 | |||||
|---|---|---|---|---|---|---|
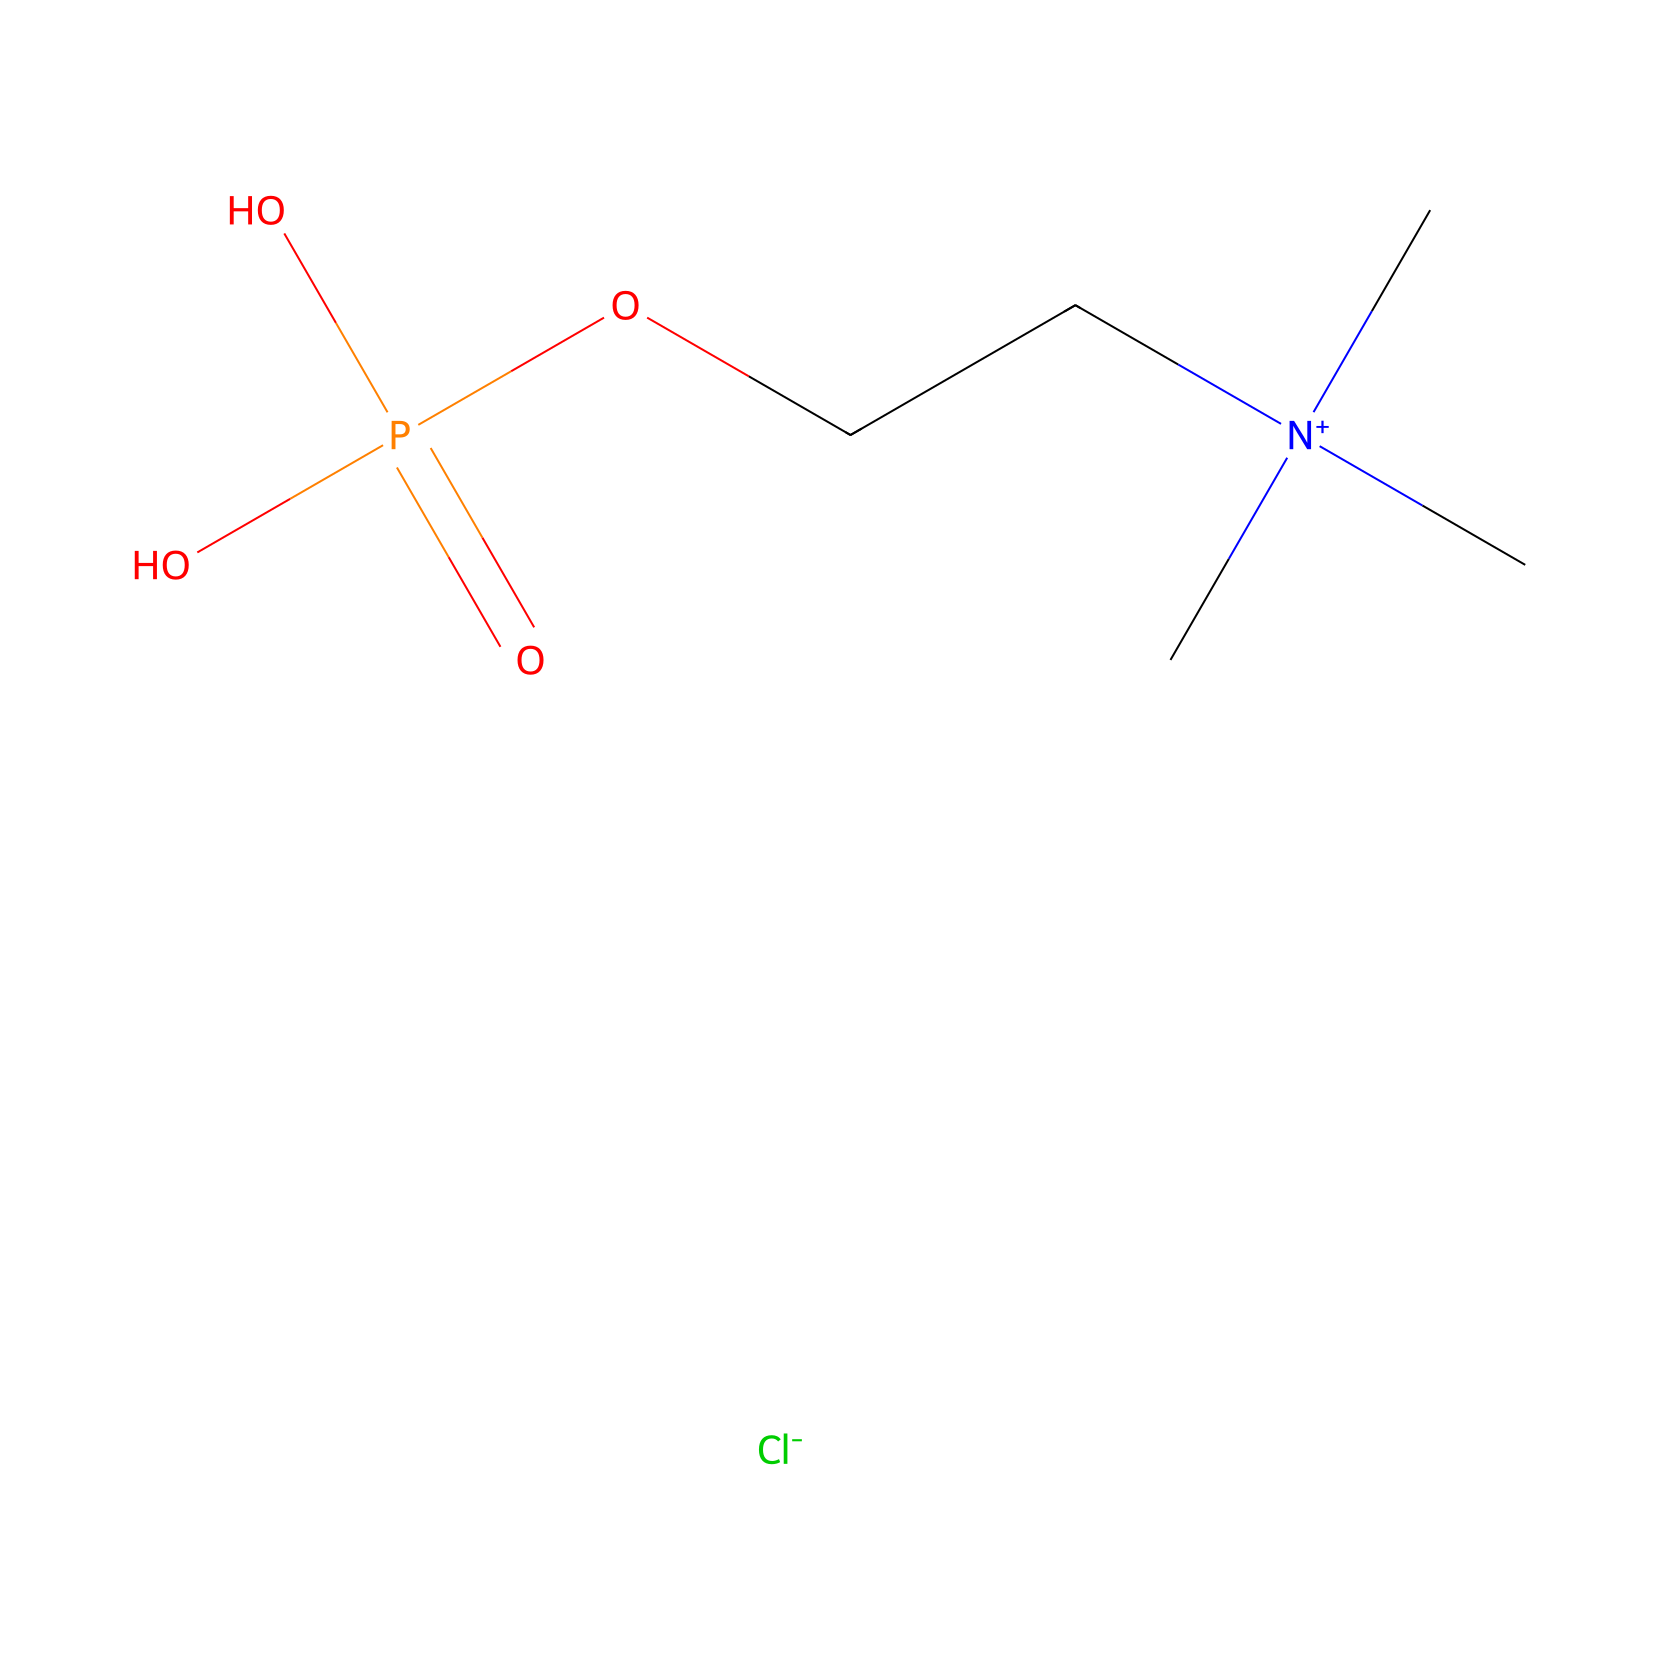
| Drug Name | Choline phosphate | |||||
| Synonyms |
107-73-3; PHOSPHORYLCHOLINE; Phosphorylcholine Chloride; choline phosphate; Choline phosphate chloride; Trimethyl-(2-Phosphonooxyethyl)Azanium Chloride; phosphocholine chloride; N,N,N-trimethyl-2-(phosphonooxy)ethanaminium chloride; Ethanaminium, N,N,N-trimethyl-2-(phosphonooxy)-, chloride; Phosphorylcholine (chloride); trimethyl(2-phosphonooxyethyl)azanium;chloride; 96AN057F7A; [2-(trimethylazaniumyl)ethoxy]phosphonic acid chloride; Trimethyl(2-(phosphonooxy)ethyl)ammonium chloride; UNII-96AN057F7A; Ethanaminium, N,N,N-trimethyl-2-(phosphonooxy)-, chloride (1:1) (ACI); Choline, chloride, dihydrogen phosphate (7CI, 8CI); Ethanaminium, N,N,N-trimethyl-2-(phosphonooxy)-, chloride (9CI); Choline phosphate; Choline phosphate chloride; Choline phosphochlor; EINECS 203-516-6; FOSFORYLCHOLINE; Choline phosphochloride; PC-Cl; SCHEMBL24426; PHOSPHORYLCHOLINE [MI]; FOSFORYLCHOLINE [MART.]; CHEBI:61040; DTXSID90910205; HY-B2233; AKOS027327289; CS-7829; WS-03268; DB-257203; NS00041278; E85458; [2-(phosphonooxy)ethyl]trimethylammonium chloride; (2-HYDROXYETHYL)TRIMETHYLAMMONIUM CHLORIDE DIHYDROGEN PHOSPHATE
Click to Show/Hide
|
|||||
| Structure |
|
|||||
| Formula |
C5H15ClNO4P
|
|||||
| #Ro5 Violations (Lipinski): 0 | Molecular Weight (mw) | 219.6 | ||||
| Lipid-water partition coefficient (xlogp) | Not Available | |||||
| Hydrogen Bond Donor Count (hbonddonor) | 2 | |||||
| Hydrogen Bond Acceptor Count (hbondacc) | 5 | |||||
| Rotatable Bond Count (rotbonds) | 4 | |||||
| PubChem CID | ||||||
| Canonical smiles |
C[N+](C)(C)CCOP(=O)(O)O.[Cl-]
|
|||||
| InChI |
InChI=1S/C5H14NO4P.ClH/c1-6(2,3)4-5-10-11(7,8)9;/h4-5H2,1-3H3,(H-,7,8,9);1H
|
|||||
| InChIKey |
PYJNAPOPMIJKJZ-UHFFFAOYSA-N
|
|||||
| IUPAC Name |
trimethyl(2-phosphonooxyethyl)azanium;chloride
|
|||||
Full Information of The Activity Data of The PDC(s) Related to This Drug
Dazdotuftide [Phase 3]
Obtained from the Model Organism Data
| Experiment 1 Reporting the Activity Data of This PDC | [1] | ||||
| Indication | Arthritis | ||||
| Efficacy Data | Reduction of arthritis severity | 7.87 | |||
| Evaluation Method | Assessment of arthritis | ||||
| Administration Time | 31 days | ||||
| Administration Dosage | 250 μg/0.1mL | ||||
| MOA of PDC |
Dazdotuftide is a novel, small synthetic molecule. It is a peptide conjugate comprised of tuftsin and phosphorylcholine that are covalently attached. The phosphorylcholine (PPC) moiety is based on a sequence from helminths secretory molecules which has been shown to be responsible for their immunoregulatory functions. Tuftsin is a naturally occurring endogenous immunomodulatory tetra-peptide (Thr-Lys-Pro-Arg) produced in the spleen by enzymatic cleavage of the Fc-domain of the heavy chain of IgG. The peptide is coupled to diazotized 4-aminophenyphosphorylchloride to form an azo bond between the tuftsin and PC. Extensive research has been done on Tuftsin and PPC separately, and the activities of each of them towards immune regulation. Dazdotuftide has been suggested to provide a strong synergistic effect, far surpassing the efficacy of the compounds given separately.
Click to Show/Hide
|
||||
| Description |
The main characteristic of RA is joint deformation due to severe inflammation, therefore we followed the TPC effect on arthritis score in CIA mice. CIA mice were subjected to TPC, orally or s.c., and compared to mice treated with PBS. As detailed in Fig. Fig.1a,b,1a,b, we observed a significantly lower arthritis score in TPCtreated mice compared with PBStreated mice (P < 0.05). Arthritis score was lower in both the TPC orally and TPC s.c.treated groups starting at 2 weeks after disease induction (day 14, 20 days after treatment initiation), until the mice were sacrificed (day 31). When the mice were sacrificed, both the TPCtreated groups had a mean arthritis score of 1.5 (range from 0 to 4), while both the PBStreated groups had a mean arthritis score of 11.8 (range from 10 to 14) (P < 0.001). TPC orally treated mice had a mean arthritis score of 1.6 1.5, while PBS orally treated mice had a mean arthritis score of 12.6 1.14 (P < 0.001). Moreover, TPC s.c.treated mice had a mean arthritis score of 1.4 0.84, whereas PBS s.c.treated mice had a mean arthritis score of 11 1.22 (P < 0.001). Representative pictures of mice joints shown in Fig. Fig.1c1c demonstrate a significant difference in inflammation in the TPCtreated mice in comparison with the PBStreated ones. PBStreated mice developed oedema and erythema from the ankle to the entire leg, while TPCtreated mice exhibited milder symptoms.
Click to Show/Hide
|
||||
| In Vivo Model | DBA/1 male mice with arthritis. | ||||
References