Peptide Information
General Information of This Peptide
| Peptide ID |
PEP00054
|
|||||
|---|---|---|---|---|---|---|
| Peptide Name |
pHLIP (GGEQ)
|
|||||
| Structure |
|
|||||
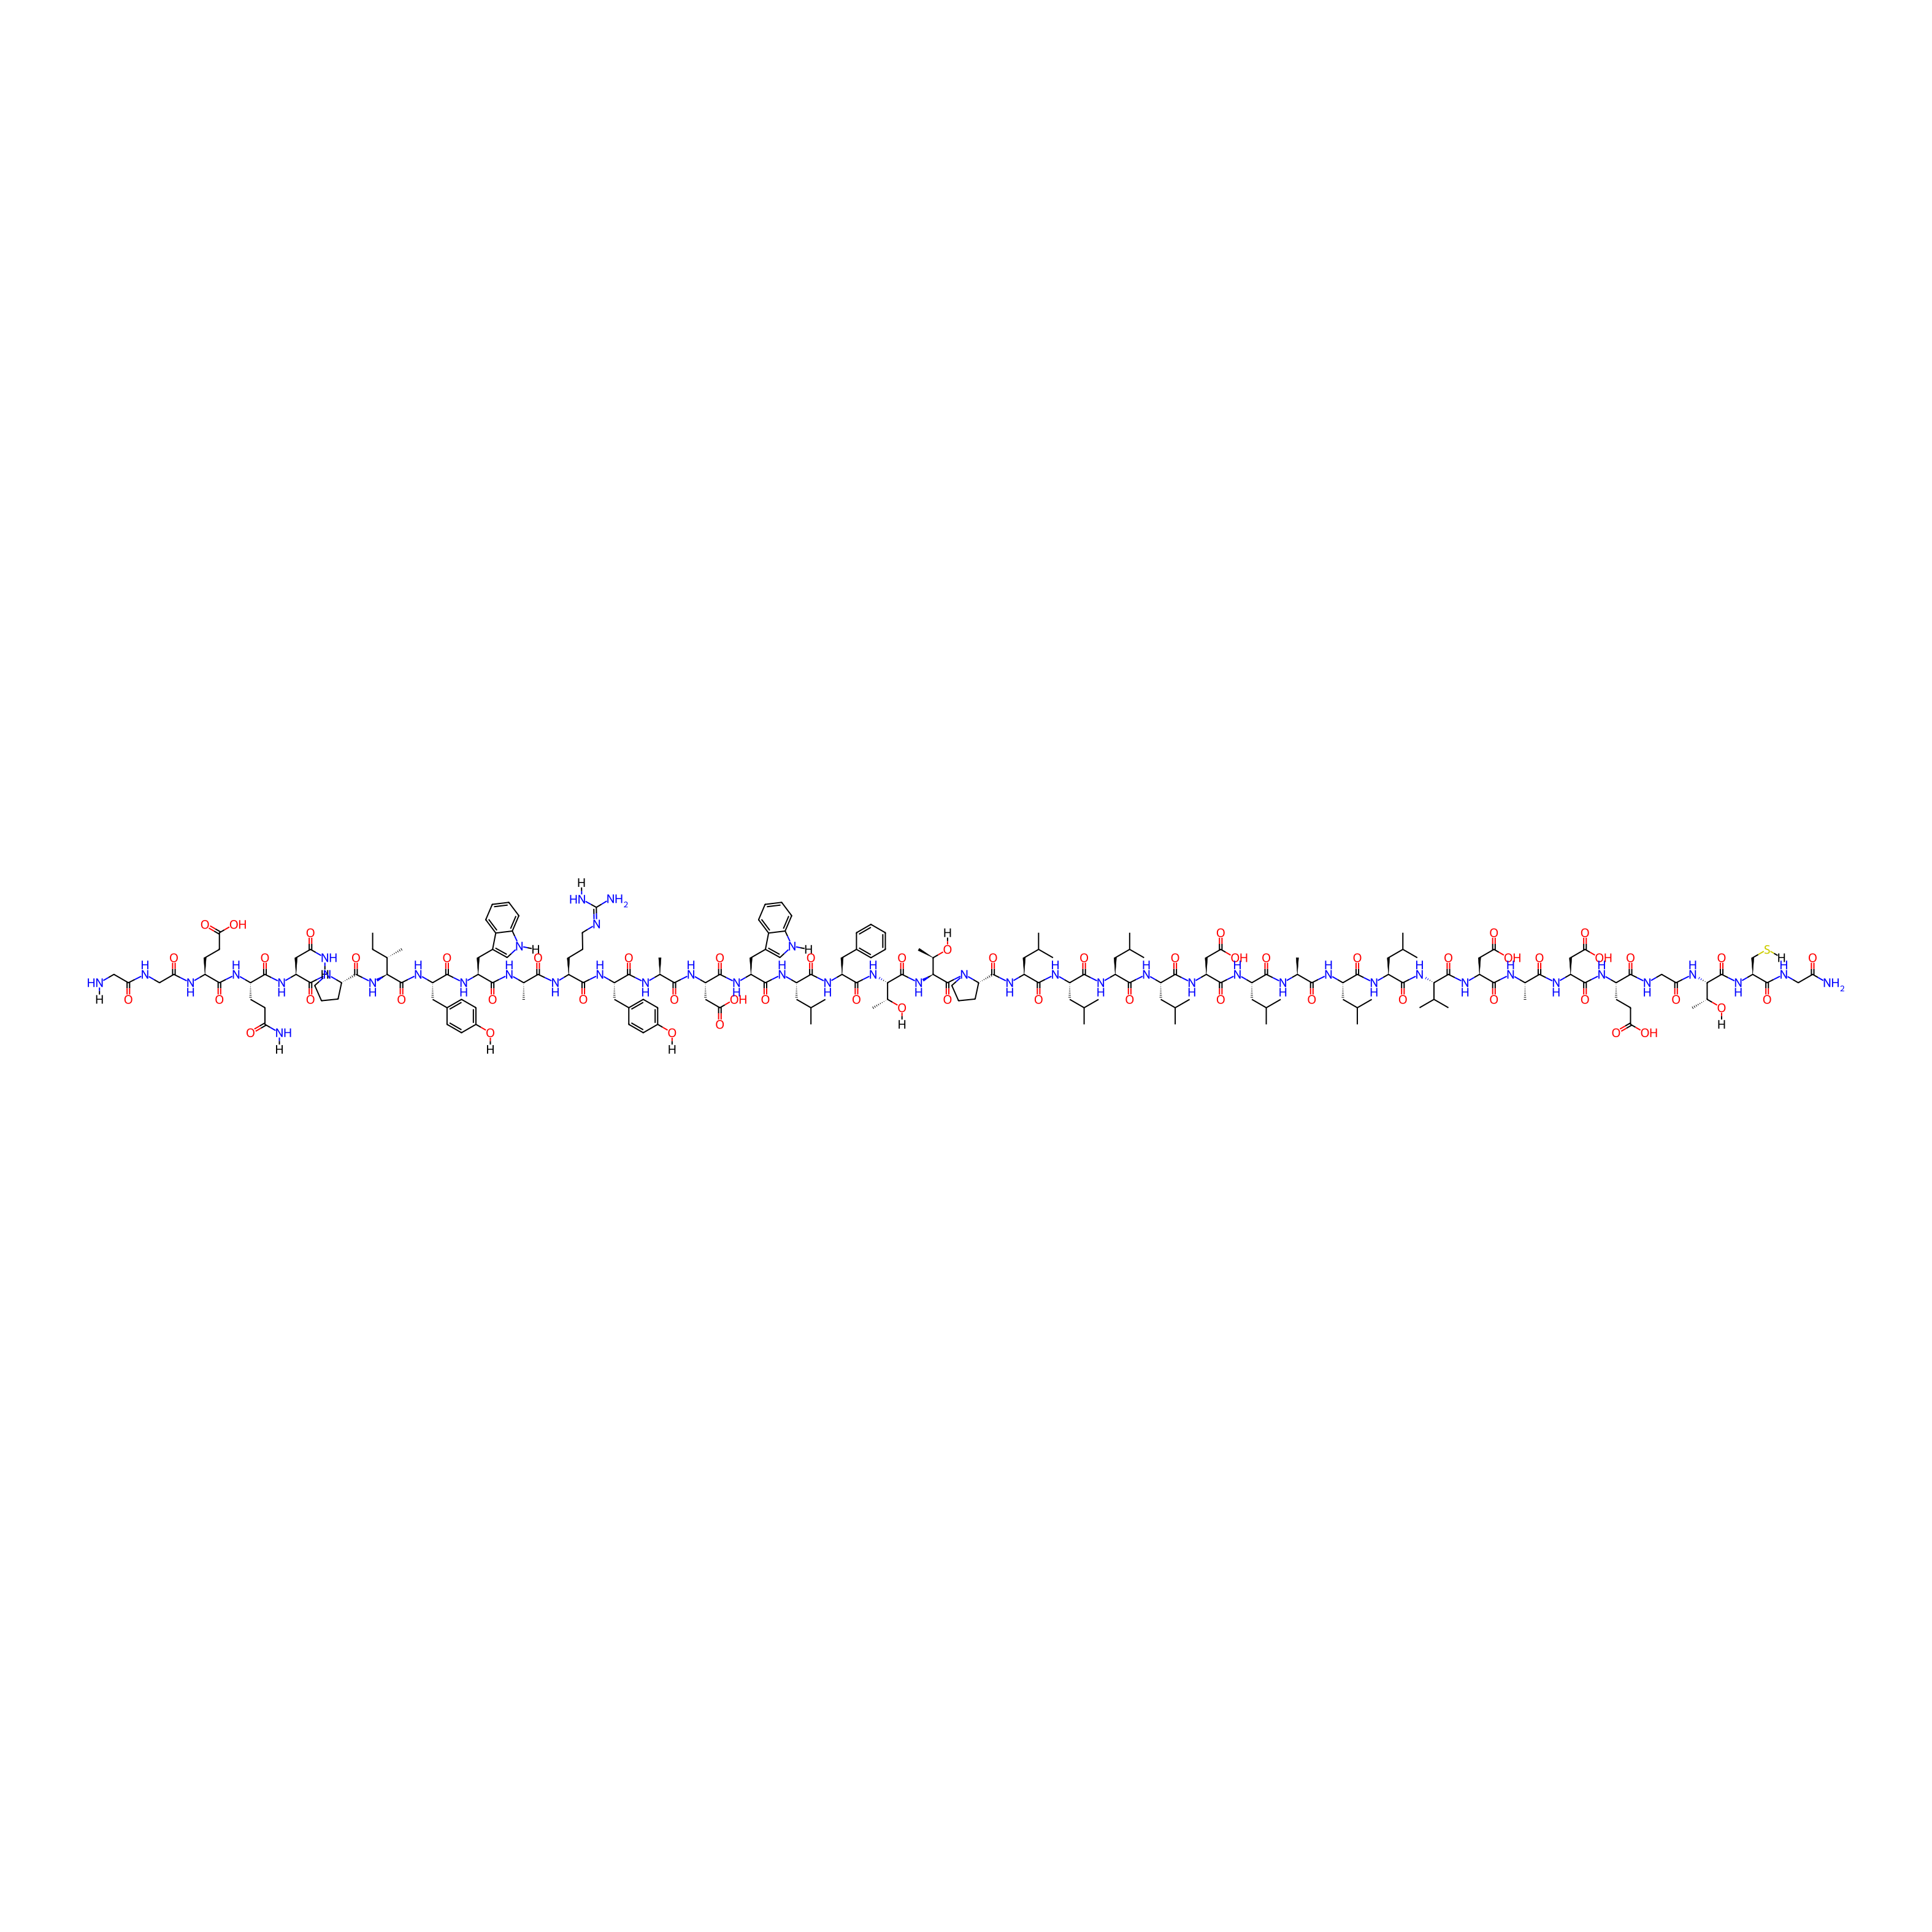
| Sequence |
H2N-GGEQNPIYWARYADWLFTTPLLLLDLALLVDADEGTCG
|
|||||
| Peptide Type |
Linear
|
|||||
| PDC Transmembrane Types | Cell-penetrating peptides (CPPs) | |||||
| Distribution |
Acidity is produced not only by cancerous tissue, but also by any tissue that is experiencing hypoxia: the lack of oxygen in the tissue triggers cells to switch to a high rate of the anaerobic, glycolytic energy production pathway, consequently resulting in acidification. pHLIPs have been shown to target infections in lungs, inflammatory arthritis, and ischemic myocardium, a consequence of heart disease, and could be used for diagnosis and treatment thereof. It is also possible that pHLIPs could be used as targeted treatment in ischemic strokes. In contrast to diseased tissue, healthy tissue is typically not associated with increased acidity except in the gastrointestinal tract and kidney, the pHs of which might be regulated by the implementation of a special diet or supplementary drinks if their acidity proves problematic.
|
|||||
| Formula |
C194H290N46O57S
|
|||||
| Isosmiles |
[H]NCC(=O)NCC(=O)N[C@@H](CCC(=O)O)C(=O)N[C@@H](CCC(=O)N[H])C(=O)N[C@@H](CC(=O)N[H])C(=O)N1CCC[C@H]1C(=O)N[C@]([H])(C(=O)N[C@@H](Cc1ccc(O[H])cc1)C(=O)N[C@@H](Cc1cn([H])c2ccccc12)C(=O)N[C@@H](C)C(=O)N[C@@H](CCC/N=C(/N)N[H])C(=O)N[C@@H](Cc1ccc(O[H])cc1)C(=O)N[C@@H](C)C(=O)N[C@@H](CC(=O)O)C(=O)N[C@@H](Cc1cn([H])c2ccccc12)C(=O)N[C@@H](CC(C)C)C(=O)N[C@@H](Cc1ccccc1)C(=O)N[C@]([H])(C(=O)N[C@]([H])(C(=O)N1CCC[C@H]1C(=O)N[C@@H](CC(C)C)C(=O)N[C@@H](CC(C)C)C(=O)N[C@@H](CC(C)C)C(=O)N[C@@H](CC(C)C)C(=O)N[C@@H](CC(=O)O)C(=O)N[C@@H](CC(C)C)C(=O)N[C@@H](C)C(=O)N[C@@H](CC(C)C)C(=O)N[C@@H](CC(C)C)C(=O)N[C@H](C(=O)N[C@@H](CC(=O)O)C(=O)N[C@@H](C)C(=O)N[C@@H](CC(=O)O)C(=O)N[C@@H](CCC(=O)O)C(=O)NCC(=O)N[C@]([H])(C(=O)N[C@@H](CS[H])C(=O)NCC(N)=O)[C@@H](C)O[H])C(C)C)[C@@H](C)O[H])[C@@H](C)O[H])[C@@H](C)CC
|
|||||
| InChI |
InChI=1S/C194H290N46O57S/c1-28-99(20)156(236-187(291)142-47-37-63-239(142)192(296)139(78-144(197)247)232-168(272)121(56-59-143(196)246)214-167(271)120(58-61-150(254)255)211-147(250)87-204-146(249)83-195)189(293)230-131(75-109-50-54-113(245)55-51-109)179(283)226-133(76-110-84-202-116-43-34-32-41-114(110)116)171(275)209-100(21)160(264)212-118(45-36-62-201-194(199)200)166(270)224-130(74-108-48-52-112(244)53-49-108)170(274)208-102(23)162(266)217-137(81-153(260)261)182(286)227-134(77-111-85-203-117-44-35-33-42-115(111)117)180(284)222-126(69-94(10)11)176(280)225-132(73-107-39-30-29-31-40-107)185(289)237-158(105(26)242)191(295)238-159(106(27)243)193(297)240-64-38-46-141(240)186(290)229-128(71-96(14)15)178(282)221-125(68-93(8)9)175(279)219-124(67-92(6)7)174(278)220-127(70-95(12)13)177(281)228-138(82-154(262)263)183(287)218-122(65-90(2)3)169(273)207-101(22)161(265)215-123(66-91(4)5)173(277)223-129(72-97(16)17)184(288)235-155(98(18)19)188(292)231-135(79-151(256)257)172(276)210-103(24)163(267)216-136(80-152(258)259)181(285)213-119(57-60-149(252)253)164(268)206-88-148(251)234-157(104(25)241)190(294)233-140(89-298)165(269)205-86-145(198)248/h29-35,39-44,48-55,84-85,90-106,118-142,155-159,202-203,241-245,298H,28,36-38,45-47,56-83,86-89,195H2,1-27H3,(H2,196,246)(H2,197,247)(H2,198,248)(H,204,249)(H,205,269)(H,206,268)(H,207,273)(H,208,274)(H,209,275)(H,210,276)(H,211,250)(H,212,264)(H,213,285)(H,214,271)(H,215,265)(H,216,267)(H,217,266)(H,218,287)(H,219,279)(H,220,278)(H,221,282)(H,222,284)(H,223,277)(H,224,270)(H,225,280)(H,226,283)(H,227,286)(H,228,281)(H,229,290)(H,230,293)(H,231,292)(H,232,272)(H,233,294)(H,234,251)(H,235,288)(H,236,291)(H,237,289)(H,238,295)(H,252,253)(H,254,255)(H,256,257)(H,258,259)(H,260,261)(H,262,263)(H4,199,200,201)/t99-,100-,101-,102-,103-,104+,105+,106+,118-,119-,120-,121-,122-,123-,124-,125-,126-,127-,128-,129-,130-,131-,132-,133-,134-,135-,136-,137-,138-,139-,140-,141-,142-,155-,156-,157-,158-,159-/m0/s1
|
|||||
| InChIKey |
FJDWZOCTTHZENZ-PQUDPETMSA-N
|
|||||
| Pharmaceutical Properties |
Molecule Weight
|
4210.786
|
Polar area
|
1635.34
|
||
|
Complexity
|
4208.092868
|
xlogp Value
|
-11.0925
|
|||
|
Heavy Count
|
298
|
Rot Bonds
|
136
|
|||
|
Hbond acc
|
54
|
Hbond Donor
|
55
|
|||
Each Peptide-drug Conjugate Related to This Peptide
Full Information of The Activity Data of The PDC(s) Related to This Peptide
pHLIP-PAMAM-DOX [Investigative]
Revealed Based on the Cell Line Data
| Experiment 1 Reporting the Activity Data of This PDC | [1] | ||||
| Indication | Tumor | ||||
| Efficacy Data | Cell viability |
15%
|
|||
| Administration Time | 72 h | ||||
| Administration Dosage | 10 µM | ||||
| Evaluation Method | MTS assay | ||||
| Description |
The cytotoxicity data for the pHLIP-PAMAM-DOX conjugate mirrored quite closely that of the pHLIP-S-S-DOX conjugate, particularly at the higher concentrations (>1.25 μM). However, at lower pHLIP concentrations (0.16 μM-0.63 μM), the PAMAM conjugate exhibited higher cytotoxicity than the single DOX conjugate (˜up to 17% higher toxicity).
Click to Show/Hide
|
||||
| In Vitro Model | Endocervical adenocarcinoma | HeLa cell | CVCL_0030 | ||
| Experiment 2 Reporting the Activity Data of This PDC | [1] | ||||
| Indication | Tumor | ||||
| Efficacy Data | Cell viability |
20%
|
|||
| Administration Time | 72 h | ||||
| Administration Dosage | 2.5 µM | ||||
| Evaluation Method | MTS assay | ||||
| Description |
The cytotoxicity data for the pHLIP-PAMAM-DOX conjugate mirrored quite closely that of the pHLIP-S-S-DOX conjugate, particularly at the higher concentrations (>1.25 μM). However, at lower pHLIP concentrations (0.16 μM-0.63 μM), the PAMAM conjugate exhibited higher cytotoxicity than the single DOX conjugate (˜up to 17% higher toxicity).
Click to Show/Hide
|
||||
| In Vitro Model | Endocervical adenocarcinoma | HeLa cell | CVCL_0030 | ||
| Experiment 3 Reporting the Activity Data of This PDC | [1] | ||||
| Indication | Tumor | ||||
| Efficacy Data | Cell viability |
20%
|
|||
| Administration Time | 72 h | ||||
| Administration Dosage | 5.0 µM | ||||
| Evaluation Method | MTS assay | ||||
| Description |
The cytotoxicity data for the pHLIP-PAMAM-DOX conjugate mirrored quite closely that of the pHLIP-S-S-DOX conjugate, particularly at the higher concentrations (>1.25 μM). However, at lower pHLIP concentrations (0.16 μM-0.63 μM), the PAMAM conjugate exhibited higher cytotoxicity than the single DOX conjugate (˜up to 17% higher toxicity).
Click to Show/Hide
|
||||
| In Vitro Model | Endocervical adenocarcinoma | HeLa cell | CVCL_0030 | ||
| Experiment 4 Reporting the Activity Data of This PDC | [1] | ||||
| Indication | Tumor | ||||
| Efficacy Data | Cell viability |
90%
|
|||
| Administration Time | 72 h | ||||
| Administration Dosage | 0.16 µM | ||||
| Evaluation Method | MTS assay | ||||
| Description |
The cytotoxicity data for the pHLIP-PAMAM-DOX conjugate mirrored quite closely that of the pHLIP-S-S-DOX conjugate, particularly at the higher concentrations (>1.25 μM). However, at lower pHLIP concentrations (0.16 μM-0.63 μM), the PAMAM conjugate exhibited higher cytotoxicity than the single DOX conjugate (˜up to 17% higher toxicity).
Click to Show/Hide
|
||||
| In Vitro Model | Endocervical adenocarcinoma | HeLa cell | CVCL_0030 | ||
| Experiment 5 Reporting the Activity Data of This PDC | [1] | ||||
| Indication | Tumor | ||||
| Efficacy Data | Cell viability |
90%
|
|||
| Administration Time | 72 h | ||||
| Administration Dosage | 0.31 µM | ||||
| Evaluation Method | MTS assay | ||||
| Description |
The cytotoxicity data for the pHLIP-PAMAM-DOX conjugate mirrored quite closely that of the pHLIP-S-S-DOX conjugate, particularly at the higher concentrations (>1.25 μM). However, at lower pHLIP concentrations (0.16 μM-0.63 μM), the PAMAM conjugate exhibited higher cytotoxicity than the single DOX conjugate (˜up to 17% higher toxicity).
Click to Show/Hide
|
||||
| In Vitro Model | Endocervical adenocarcinoma | HeLa cell | CVCL_0030 | ||
| Experiment 6 Reporting the Activity Data of This PDC | [1] | ||||
| Indication | Tumor | ||||
| Efficacy Data | Cell viability |
90%
|
|||
| Administration Time | 72 h | ||||
| Administration Dosage | 1.3 µM | ||||
| Evaluation Method | MTS assay | ||||
| Description |
The cytotoxicity data for the pHLIP-PAMAM-DOX conjugate mirrored quite closely that of the pHLIP-S-S-DOX conjugate, particularly at the higher concentrations (>1.25 μM). However, at lower pHLIP concentrations (0.16 μM-0.63 μM), the PAMAM conjugate exhibited higher cytotoxicity than the single DOX conjugate (˜up to 17% higher toxicity).
Click to Show/Hide
|
||||
| In Vitro Model | Endocervical adenocarcinoma | HeLa cell | CVCL_0030 | ||
| Experiment 7 Reporting the Activity Data of This PDC | [1] | ||||
| Indication | Tumor | ||||
| Efficacy Data | Cell viability |
95%
|
|||
| Administration Time | 72 h | ||||
| Administration Dosage | 0.63 µM | ||||
| Evaluation Method | MTS assay | ||||
| Description |
The cytotoxicity data for the pHLIP-PAMAM-DOX conjugate mirrored quite closely that of the pHLIP-S-S-DOX conjugate, particularly at the higher concentrations (>1.25 μM). However, at lower pHLIP concentrations (0.16 μM-0.63 μM), the PAMAM conjugate exhibited higher cytotoxicity than the single DOX conjugate (˜up to 17% higher toxicity).
Click to Show/Hide
|
||||
| In Vitro Model | Endocervical adenocarcinoma | HeLa cell | CVCL_0030 | ||
| Experiment 8 Reporting the Activity Data of This PDC | [1] | ||||
| Indication | Tumor | ||||
| Efficacy Data | Cell viability |
98%
|
|||
| Administration Time | 72 h | ||||
| Administration Dosage | 10 µM | ||||
| Evaluation Method | MTS assay | ||||
| Description |
The cytotoxicity data for the pHLIP-PAMAM-DOX conjugate mirrored quite closely that of the pHLIP-S-S-DOX conjugate, particularly at the higher concentrations (>1.25 μM). However, at lower pHLIP concentrations (0.16 μM-0.63 μM), the PAMAM conjugate exhibited higher cytotoxicity than the single DOX conjugate (˜up to 17% higher toxicity).
Click to Show/Hide
|
||||
| In Vitro Model | Endocervical adenocarcinoma | HeLa cell | CVCL_0030 | ||
| Experiment 9 Reporting the Activity Data of This PDC | [1] | ||||
| Indication | Tumor | ||||
| Efficacy Data | Cell viability |
100%
|
|||
| Administration Time | 72 h | ||||
| Administration Dosage | 2.5 µM | ||||
| Evaluation Method | MTS assay | ||||
| Description |
The cytotoxicity data for the pHLIP-PAMAM-DOX conjugate mirrored quite closely that of the pHLIP-S-S-DOX conjugate, particularly at the higher concentrations (>1.25 μM). However, at lower pHLIP concentrations (0.16 μM-0.63 μM), the PAMAM conjugate exhibited higher cytotoxicity than the single DOX conjugate (˜up to 17% higher toxicity).
Click to Show/Hide
|
||||
| In Vitro Model | Endocervical adenocarcinoma | HeLa cell | CVCL_0030 | ||
| Experiment 10 Reporting the Activity Data of This PDC | [1] | ||||
| Indication | Tumor | ||||
| Efficacy Data | Cell viability |
100%
|
|||
| Administration Time | 72 h | ||||
| Administration Dosage | 5.0 µM | ||||
| Evaluation Method | MTS assay | ||||
| Description |
The cytotoxicity data for the pHLIP-PAMAM-DOX conjugate mirrored quite closely that of the pHLIP-S-S-DOX conjugate, particularly at the higher concentrations (>1.25 μM). However, at lower pHLIP concentrations (0.16 μM-0.63 μM), the PAMAM conjugate exhibited higher cytotoxicity than the single DOX conjugate (˜up to 17% higher toxicity).
Click to Show/Hide
|
||||
| In Vitro Model | Endocervical adenocarcinoma | HeLa cell | CVCL_0030 | ||
pHLIP-S-S-DOX [Investigative]
Revealed Based on the Cell Line Data
| Experiment 1 Reporting the Activity Data of This PDC | [1] | ||||
| Indication | Tumor | ||||
| Efficacy Data | Cell viability |
18%
|
|||
| Administration Time | 72 h | ||||
| Administration Dosage | 10 µM | ||||
| Evaluation Method | MTS assay | ||||
| Description |
HeLa cells treated with pHLIP-S-S-DOX at low pH showed significant toxicity (˜50% viability at the lowest concentration tested (0.16 μM pHLIP)) which, in this construct, corresponds to the DOX concentration. Cellular viability tracked inversely with increasing pHLIP conjugate concentration, peaking at ˜18% viability at 16 μM.
|
||||
| In Vitro Model | Endocervical adenocarcinoma | HeLa cell | CVCL_0030 | ||
| Experiment 2 Reporting the Activity Data of This PDC | [1] | ||||
| Indication | Tumor | ||||
| Efficacy Data | Cell viability |
20%
|
|||
| Administration Time | 72 h | ||||
| Administration Dosage | 1.3 µM | ||||
| Evaluation Method | MTS assay | ||||
| Description |
HeLa cells treated with pHLIP-S-S-DOX at low pH showed significant toxicity (˜50% viability at the lowest concentration tested (0.16 μM pHLIP)) which, in this construct, corresponds to the DOX concentration. Cellular viability tracked inversely with increasing pHLIP conjugate concentration, peaking at ˜18% viability at 13 μM.
|
||||
| In Vitro Model | Endocervical adenocarcinoma | HeLa cell | CVCL_0030 | ||
| Experiment 3 Reporting the Activity Data of This PDC | [1] | ||||
| Indication | Tumor | ||||
| Efficacy Data | Cell viability |
22%
|
|||
| Administration Time | 72 h | ||||
| Administration Dosage | 2.5 µM | ||||
| Evaluation Method | MTS assay | ||||
| Description |
HeLa cells treated with pHLIP-S-S-DOX at low pH showed significant toxicity (˜50% viability at the lowest concentration tested (0.16 μM pHLIP)) which, in this construct, corresponds to the DOX concentration. Cellular viability tracked inversely with increasing pHLIP conjugate concentration, peaking at ˜18% viability at 14 μM.
|
||||
| In Vitro Model | Endocervical adenocarcinoma | HeLa cell | CVCL_0030 | ||
| Experiment 4 Reporting the Activity Data of This PDC | [1] | ||||
| Indication | Tumor | ||||
| Efficacy Data | Cell viability |
22%
|
|||
| Administration Time | 72 h | ||||
| Administration Dosage | 5.0 µM | ||||
| Evaluation Method | MTS assay | ||||
| Description |
HeLa cells treated with pHLIP-S-S-DOX at low pH showed significant toxicity (˜50% viability at the lowest concentration tested (0.16 μM pHLIP)) which, in this construct, corresponds to the DOX concentration. Cellular viability tracked inversely with increasing pHLIP conjugate concentration, peaking at ˜18% viability at 15 μM.
|
||||
| In Vitro Model | Endocervical adenocarcinoma | HeLa cell | CVCL_0030 | ||
| Experiment 5 Reporting the Activity Data of This PDC | [1] | ||||
| Indication | Tumor | ||||
| Efficacy Data | Cell viability |
30%
|
|||
| Administration Time | 72 h | ||||
| Administration Dosage | 0.31 µM | ||||
| Evaluation Method | MTS assay | ||||
| Description |
The cytotoxicity data for the pHLIP-PAMAM-DOX conjugate mirrored quite closely that of the pHLIP-S-S-DOX conjugate, particularly at the higher concentrations (>1.25 μM). However, at lower pHLIP concentrations (0.16 μM-0.63 μM), the PAMAM conjugate exhibited higher cytotoxicity than the single DOX conjugate (˜up to 17% higher toxicity).
Click to Show/Hide
|
||||
| In Vitro Model | Endocervical adenocarcinoma | HeLa cell | CVCL_0030 | ||
| Experiment 6 Reporting the Activity Data of This PDC | [1] | ||||
| Indication | Tumor | ||||
| Efficacy Data | Cell viability |
30%
|
|||
| Administration Time | 72 h | ||||
| Administration Dosage | 0.63 µM | ||||
| Evaluation Method | MTS assay | ||||
| Description |
The cytotoxicity data for the pHLIP-PAMAM-DOX conjugate mirrored quite closely that of the pHLIP-S-S-DOX conjugate, particularly at the higher concentrations (>1.25 μM). However, at lower pHLIP concentrations (0.16 μM-0.63 μM), the PAMAM conjugate exhibited higher cytotoxicity than the single DOX conjugate (˜up to 17% higher toxicity).
Click to Show/Hide
|
||||
| In Vitro Model | Endocervical adenocarcinoma | HeLa cell | CVCL_0030 | ||
| Experiment 7 Reporting the Activity Data of This PDC | [1] | ||||
| Indication | Tumor | ||||
| Efficacy Data | Cell viability |
30%
|
|||
| Administration Time | 72 h | ||||
| Administration Dosage | 1.3 µM | ||||
| Evaluation Method | MTS assay | ||||
| Description |
The cytotoxicity data for the pHLIP-PAMAM-DOX conjugate mirrored quite closely that of the pHLIP-S-S-DOX conjugate, particularly at the higher concentrations (>1.25 μM). However, at lower pHLIP concentrations (0.16 μM-0.63 μM), the PAMAM conjugate exhibited higher cytotoxicity than the single DOX conjugate (˜up to 17% higher toxicity).
Click to Show/Hide
|
||||
| In Vitro Model | Endocervical adenocarcinoma | HeLa cell | CVCL_0030 | ||
| Experiment 8 Reporting the Activity Data of This PDC | [1] | ||||
| Indication | Tumor | ||||
| Efficacy Data | Cell viability |
38%
|
|||
| Administration Time | 72 h | ||||
| Administration Dosage | 0.16 µM | ||||
| Evaluation Method | MTS assay | ||||
| Description |
The cytotoxicity data for the pHLIP-PAMAM-DOX conjugate mirrored quite closely that of the pHLIP-S-S-DOX conjugate, particularly at the higher concentrations (>1.25 μM). However, at lower pHLIP concentrations (0.16 μM-0.63 μM), the PAMAM conjugate exhibited higher cytotoxicity than the single DOX conjugate (˜up to 17% higher toxicity).
Click to Show/Hide
|
||||
| In Vitro Model | Endocervical adenocarcinoma | HeLa cell | CVCL_0030 | ||
| Experiment 9 Reporting the Activity Data of This PDC | [1] | ||||
| Indication | Tumor | ||||
| Efficacy Data | Cell viability |
42%
|
|||
| Administration Time | 72 h | ||||
| Administration Dosage | 0.63 µM | ||||
| Evaluation Method | MTS assay | ||||
| Description |
HeLa cells treated with pHLIP-S-S-DOX at low pH showed significant toxicity (˜50% viability at the lowest concentration tested (0.16 μM pHLIP)) which, in this construct, corresponds to the DOX concentration. Cellular viability tracked inversely with increasing pHLIP conjugate concentration, peaking at ˜18% viability at 12 μM.
|
||||
| In Vitro Model | Endocervical adenocarcinoma | HeLa cell | CVCL_0030 | ||
| Experiment 10 Reporting the Activity Data of This PDC | [1] | ||||
| Indication | Tumor | ||||
| Efficacy Data | Cell viability |
45%
|
|||
| Administration Time | 72 h | ||||
| Administration Dosage | 0.31 µM | ||||
| Evaluation Method | MTS assay | ||||
| Description |
HeLa cells treated with pHLIP-S-S-DOX at low pH showed significant toxicity (˜50% viability at the lowest concentration tested (0.16 μM pHLIP)) which, in this construct, corresponds to the DOX concentration. Cellular viability tracked inversely with increasing pHLIP conjugate concentration, peaking at ˜18% viability at 11 μM.
|
||||
| In Vitro Model | Endocervical adenocarcinoma | HeLa cell | CVCL_0030 | ||
| Experiment 11 Reporting the Activity Data of This PDC | [1] | ||||
| Indication | Tumor | ||||
| Efficacy Data | Cell viability |
50%
|
|||
| Administration Time | 72 h | ||||
| Administration Dosage | 0.16 µM | ||||
| Evaluation Method | MTS assay | ||||
| Description |
HeLa cells treated with pHLIP-S-S-DOX at low pH showed significant toxicity (˜50% viability at the lowest concentration tested (0.16 μM pHLIP)) which, in this construct, corresponds to the DOX concentration. Cellular viability tracked inversely with increasing pHLIP conjugate concentration, peaking at ˜18% viability at 10 μM.
|
||||
| In Vitro Model | Endocervical adenocarcinoma | HeLa cell | CVCL_0030 | ||
| Experiment 12 Reporting the Activity Data of This PDC | [1] | ||||
| Indication | Tumor | ||||
| Efficacy Data | Cell viability |
90%
|
|||
| Administration Time | 72 h | ||||
| Administration Dosage | 0.63 µM | ||||
| Evaluation Method | MTS assay | ||||
| Description |
HeLa cells treated with pHLIP-S-S-DOX at low pH showed significant toxicity (˜50% viability at the lowest concentration tested (0.16 μM pHLIP)) which, in this construct, corresponds to the DOX concentration. Cellular viability tracked inversely with increasing pHLIP conjugate concentration, peaking at ˜18% viability at 19 μM.
|
||||
| In Vitro Model | Endocervical adenocarcinoma | HeLa cell | CVCL_0030 | ||
| Experiment 13 Reporting the Activity Data of This PDC | [1] | ||||
| Indication | Tumor | ||||
| Efficacy Data | Cell viability |
95%
|
|||
| Administration Time | 72 h | ||||
| Administration Dosage | 0.16 µM | ||||
| Evaluation Method | MTS assay | ||||
| Description |
HeLa cells treated with pHLIP-S-S-DOX at low pH showed significant toxicity (˜50% viability at the lowest concentration tested (0.16 μM pHLIP)) which, in this construct, corresponds to the DOX concentration. Cellular viability tracked inversely with increasing pHLIP conjugate concentration, peaking at ˜18% viability at 17 μM.
|
||||
| In Vitro Model | Endocervical adenocarcinoma | HeLa cell | CVCL_0030 | ||
| Experiment 14 Reporting the Activity Data of This PDC | [1] | ||||
| Indication | Tumor | ||||
| Efficacy Data | Cell viability |
98%
|
|||
| Administration Time | 72 h | ||||
| Administration Dosage | 0.31 µM | ||||
| Evaluation Method | MTS assay | ||||
| Description |
HeLa cells treated with pHLIP-S-S-DOX at low pH showed significant toxicity (˜50% viability at the lowest concentration tested (0.16 μM pHLIP)) which, in this construct, corresponds to the DOX concentration. Cellular viability tracked inversely with increasing pHLIP conjugate concentration, peaking at ˜18% viability at 18 μM.
|
||||
| In Vitro Model | Endocervical adenocarcinoma | HeLa cell | CVCL_0030 | ||
| Experiment 15 Reporting the Activity Data of This PDC | [1] | ||||
| Indication | Tumor | ||||
| Efficacy Data | Cell viability |
99%
|
|||
| Administration Time | 72 h | ||||
| Administration Dosage | 10 µM | ||||
| Evaluation Method | MTS assay | ||||
| Description |
HeLa cells treated with pHLIP-S-S-DOX at low pH showed significant toxicity (˜50% viability at the lowest concentration tested (0.16 μM pHLIP)) which, in this construct, corresponds to the DOX concentration. Cellular viability tracked inversely with increasing pHLIP conjugate concentration, peaking at ˜18% viability at 23 μM.
|
||||
| In Vitro Model | Endocervical adenocarcinoma | HeLa cell | CVCL_0030 | ||
| Experiment 16 Reporting the Activity Data of This PDC | [1] | ||||
| Indication | Tumor | ||||
| Efficacy Data | Cell viability |
100%
|
|||
| Administration Time | 72 h | ||||
| Administration Dosage | 1.3 µM | ||||
| Evaluation Method | MTS assay | ||||
| Description |
HeLa cells treated with pHLIP-S-S-DOX at low pH showed significant toxicity (˜50% viability at the lowest concentration tested (0.16 μM pHLIP)) which, in this construct, corresponds to the DOX concentration. Cellular viability tracked inversely with increasing pHLIP conjugate concentration, peaking at ˜18% viability at 20 μM.
|
||||
| In Vitro Model | Endocervical adenocarcinoma | HeLa cell | CVCL_0030 | ||
| Experiment 17 Reporting the Activity Data of This PDC | [1] | ||||
| Indication | Tumor | ||||
| Efficacy Data | Cell viability |
100%
|
|||
| Administration Time | 72 h | ||||
| Administration Dosage | 2.5 µM | ||||
| Evaluation Method | MTS assay | ||||
| Description |
HeLa cells treated with pHLIP-S-S-DOX at low pH showed significant toxicity (˜50% viability at the lowest concentration tested (0.16 μM pHLIP)) which, in this construct, corresponds to the DOX concentration. Cellular viability tracked inversely with increasing pHLIP conjugate concentration, peaking at ˜18% viability at 21 μM.
|
||||
| In Vitro Model | Endocervical adenocarcinoma | HeLa cell | CVCL_0030 | ||
| Experiment 18 Reporting the Activity Data of This PDC | [1] | ||||
| Indication | Tumor | ||||
| Efficacy Data | Cell viability |
100%
|
|||
| Administration Time | 72 h | ||||
| Administration Dosage | 5.0 µM | ||||
| Evaluation Method | MTS assay | ||||
| Description |
HeLa cells treated with pHLIP-S-S-DOX at low pH showed significant toxicity (˜50% viability at the lowest concentration tested (0.16 μM pHLIP)) which, in this construct, corresponds to the DOX concentration. Cellular viability tracked inversely with increasing pHLIP conjugate concentration, peaking at ˜18% viability at 22 μM.
|
||||
| In Vitro Model | Endocervical adenocarcinoma | HeLa cell | CVCL_0030 | ||
pHLIP-M-DOX [Investigative]
Revealed Based on the Cell Line Data
| Experiment 1 Reporting the Activity Data of This PDC | [1] | ||||
| Indication | Tumor | ||||
| Efficacy Data | Cell viability |
97%
|
|||
| Administration Time | 72 h | ||||
| Administration Dosage | 5 µM | ||||
| Evaluation Method | MTS assay | ||||
| Description |
pHLIP-M-DOX had a negligible effect on HeLa cell proliferation when incubated on cells at either pH at pHLIP concentrations as high as 10 μM. This is consistent with our imaging data that showed no release of DOX into the cell interior at either pH.
|
||||
| In Vitro Model | Endocervical adenocarcinoma | HeLa cell | CVCL_0030 | ||
| Experiment 2 Reporting the Activity Data of This PDC | [1] | ||||
| Indication | Tumor | ||||
| Efficacy Data | Cell viability |
97%
|
|||
| Administration Time | 72 h | ||||
| Administration Dosage | 10 µM | ||||
| Evaluation Method | MTS assay | ||||
| Description |
pHLIP-M-DOX had a negligible effect on HeLa cell proliferation when incubated on cells at either pH at pHLIP concentrations as high as 10 μM. This is consistent with our imaging data that showed no release of DOX into the cell interior at either pH.
|
||||
| In Vitro Model | Endocervical adenocarcinoma | HeLa cell | CVCL_0030 | ||
| Experiment 3 Reporting the Activity Data of This PDC | [1] | ||||
| Indication | Tumor | ||||
| Efficacy Data | Cell viability |
98%
|
|||
| Administration Time | 72 h | ||||
| Administration Dosage | 2.5 µM | ||||
| Evaluation Method | MTS assay | ||||
| Description |
pHLIP-M-DOX had a negligible effect on HeLa cell proliferation when incubated on cells at either pH at pHLIP concentrations as high as 10 μM. This is consistent with our imaging data that showed no release of DOX into the cell interior at either pH.
|
||||
| In Vitro Model | Endocervical adenocarcinoma | HeLa cell | CVCL_0030 | ||
| Experiment 4 Reporting the Activity Data of This PDC | [1] | ||||
| Indication | Tumor | ||||
| Efficacy Data | Cell viability |
99%
|
|||
| Administration Time | 72 h | ||||
| Administration Dosage | 5 µM | ||||
| Evaluation Method | MTS assay | ||||
| Description |
pHLIP-M-DOX had a negligible effect on HeLa cell proliferation when incubated on cells at either pH at pHLIP concentrations as high as 10 μM. This is consistent with our imaging data that showed no release of DOX into the cell interior at either pH.
|
||||
| In Vitro Model | Endocervical adenocarcinoma | HeLa cell | CVCL_0030 | ||
| Experiment 5 Reporting the Activity Data of This PDC | [1] | ||||
| Indication | Tumor | ||||
| Efficacy Data | Cell viability |
100%
|
|||
| Administration Time | 72 h | ||||
| Administration Dosage | 2.5 µM | ||||
| Evaluation Method | MTS assay | ||||
| Description |
pHLIP-M-DOX had a negligible effect on HeLa cell proliferation when incubated on cells at either pH at pHLIP concentrations as high as 10 μM. This is consistent with our imaging data that showed no release of DOX into the cell interior at either pH.
|
||||
| In Vitro Model | Endocervical adenocarcinoma | HeLa cell | CVCL_0030 | ||
References