Drug Information
General Information of This Drug
| Drug ID | DRG00042 | |||||
|---|---|---|---|---|---|---|
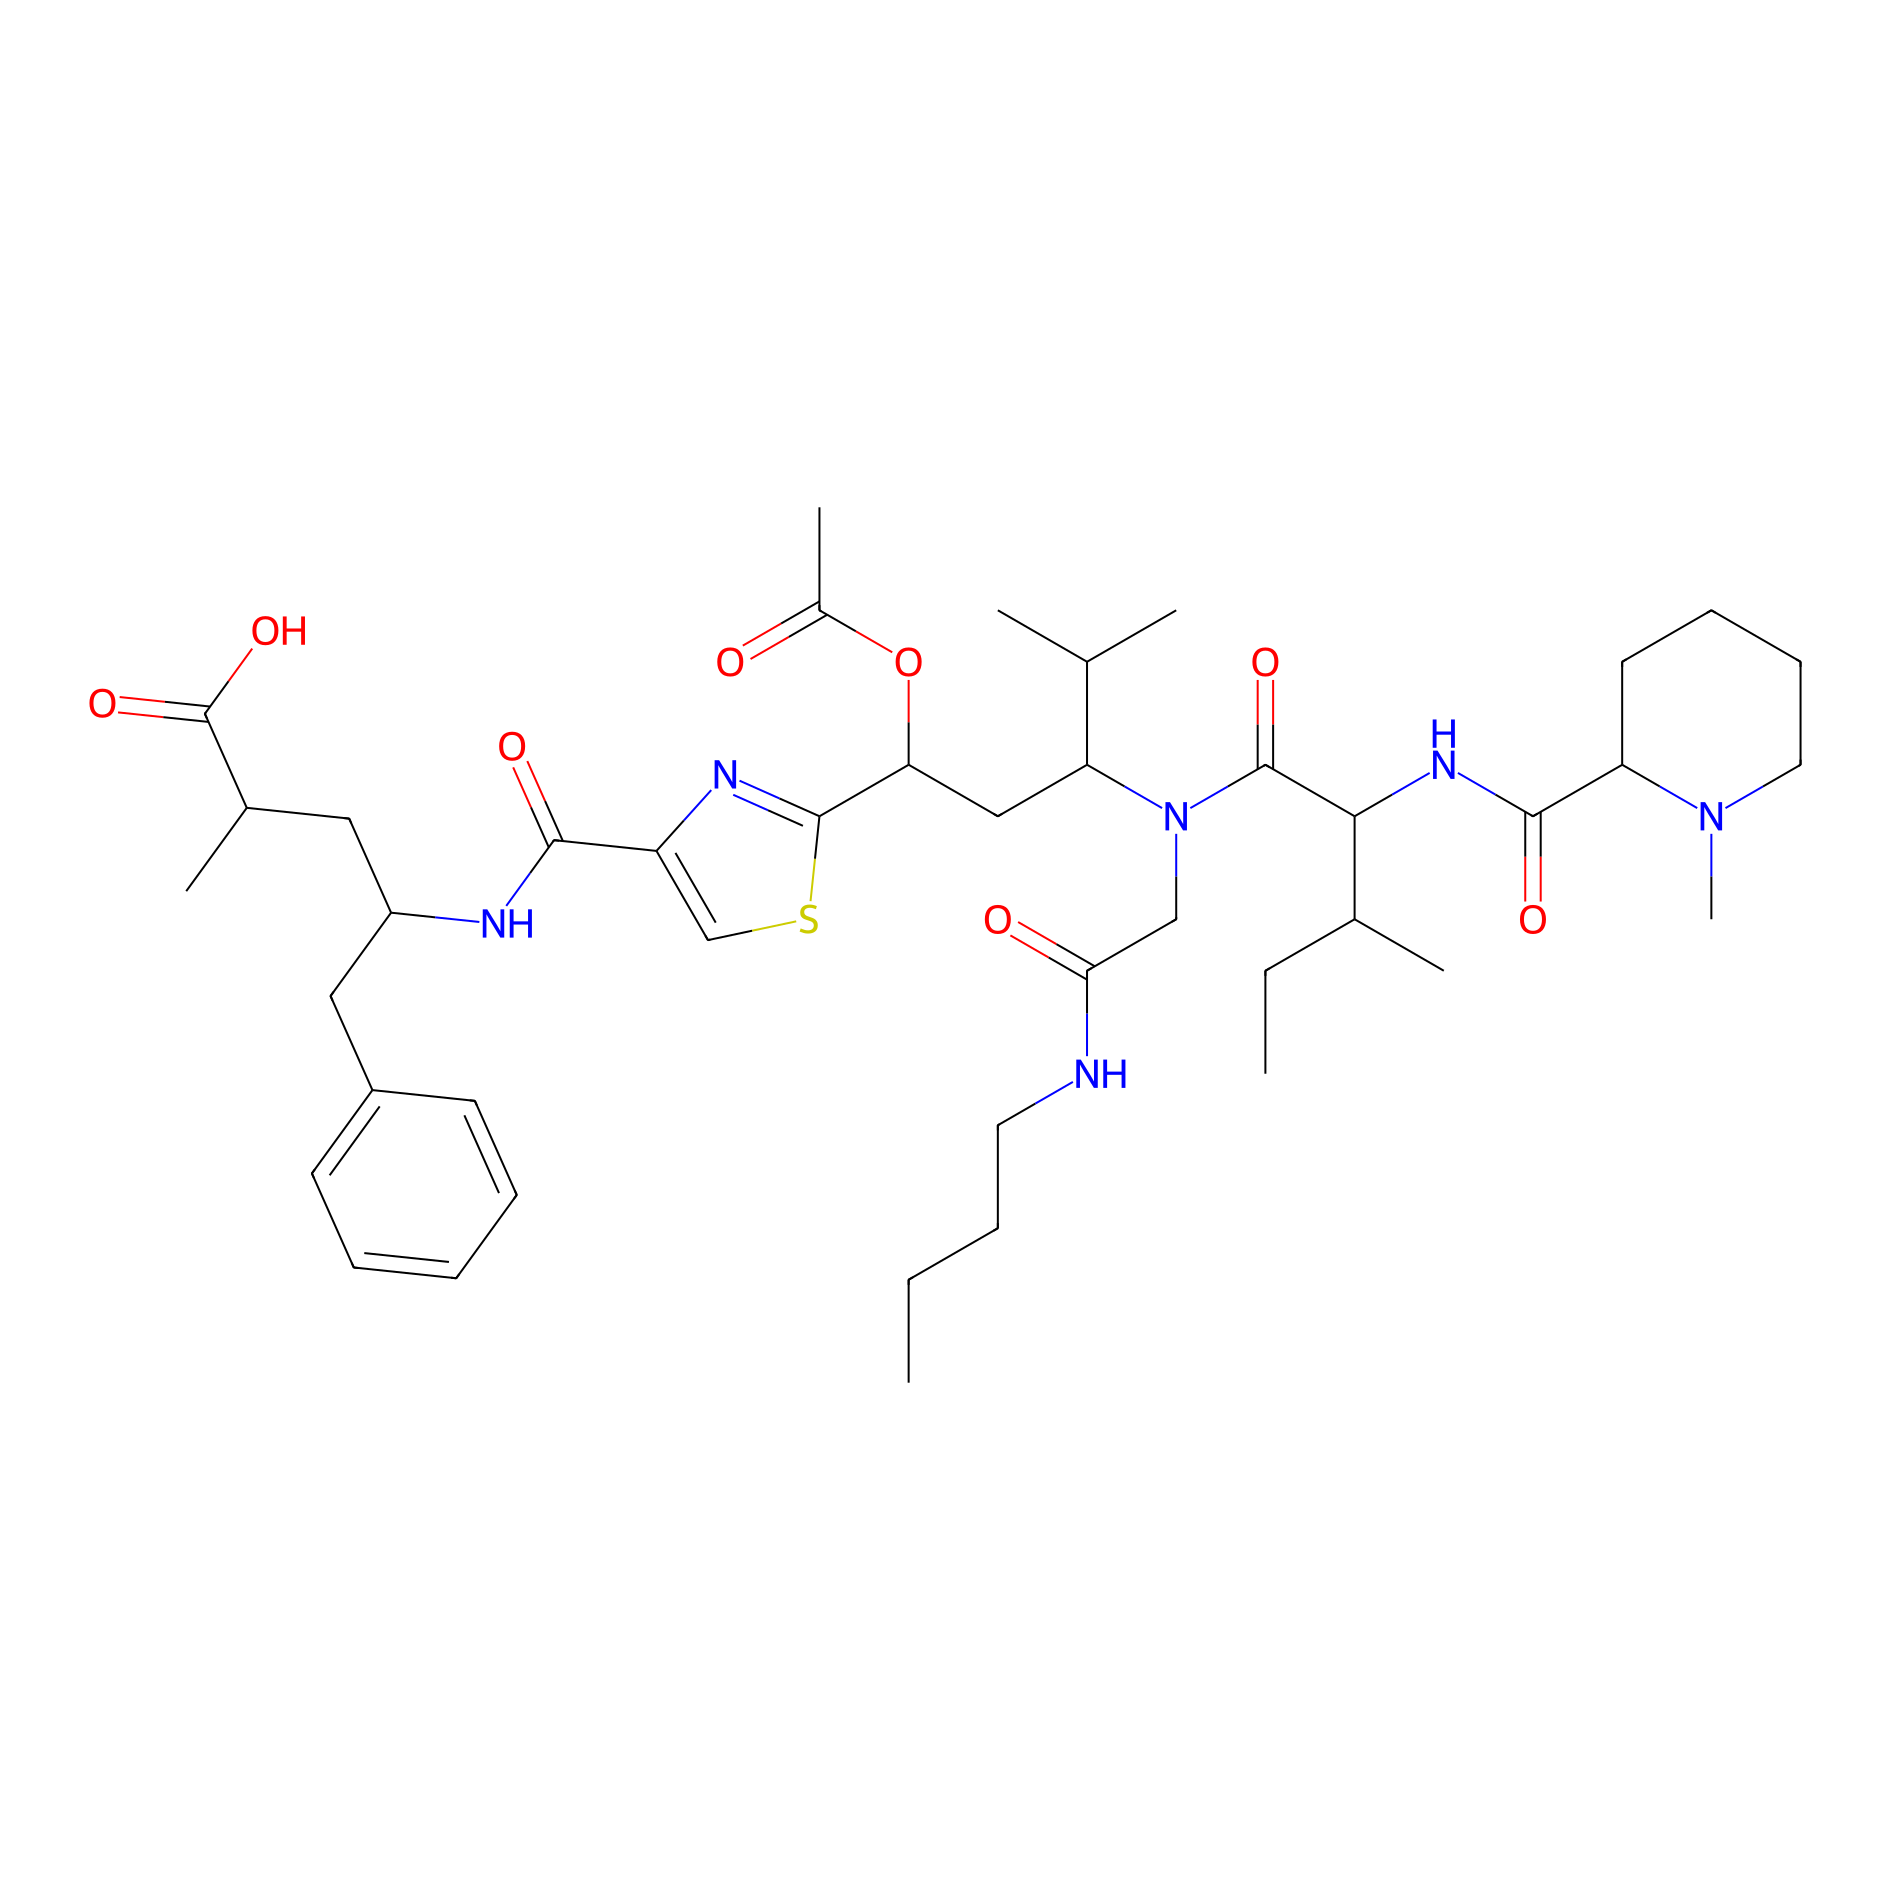
| Drug Name | Tubugis | |||||
| Target(s) | Microtubule (MT) | Target Info | ||||
| Structure |
|
|||||
| Formula |
C43H66N6O8S
|
|||||
| #Ro5 Violations (Lipinski): 3 | Molecular Weight (mw) | 827.1 | ||||
| Lipid-water partition coefficient (xlogp) | 4.4 | |||||
| Hydrogen Bond Donor Count (hbonddonor) | 4 | |||||
| Hydrogen Bond Acceptor Count (hbondacc) | 11 | |||||
| Rotatable Bond Count (rotbonds) | 24 | |||||
| PubChem CID | ||||||
| Canonical smiles |
CCCCNC(=O)CN(C(CC(C1=NC(=CS1)C(=O)NC(CC2=CC=CC=C2)CC(C)C(=O)O)OC(=O)C)C(C)C)C(=O)C(C(C)CC)NC(=O)C3CCCCN3C
|
|||||
| InChI |
InChI=1S/C43H66N6O8S/c1-9-11-20-44-37(51)25-49(42(54)38(28(5)10-2)47-40(53)34-19-15-16-21-48(34)8)35(27(3)4)24-36(57-30(7)50)41-46-33(26-58-41)39(52)45-32(22-29(6)43(55)56)23-31-17-13-12-14-18-31/h12-14,17-18,26-29,32,34-36,38H,9-11,15-16,19-25H2,1-8H3,(H,44,51)(H,45,52)(H,47,53)(H,55,56)
|
|||||
| InChIKey |
VKOLUZBARXJQRZ-UHFFFAOYSA-N
|
|||||
| IUPAC Name |
4-[[2-[1-acetyloxy-3-[[2-(butylamino)-2-oxoethyl]-[3-methyl-2-[(1-methylpiperidine-2-carbonyl)amino]pentanoyl]amino]-4-methylpentyl]-1,3-thiazole-4-carbonyl]amino]-2-methyl-5-phenylpentanoic acid
|
|||||
Each Peptide-drug Conjugate Related to This Drug
Full Information of The Activity Data of The PDC(s) Related to This Drug
Tubugi-1-NPY [Investigative]
Revealed Based on the Cell Line Data
| Experiment 1 Reporting the Activity Data of This PDC | [1] | ||||
| Indication | Tumor | ||||
| Efficacy Data | Half Maximal Inhibitory Concentration (IC50) | 205 ± 49 nM | |||
| Description |
As shown in Table 1, the cytotoxic potency of the tubugi-1-SH was - in case of HT-29 and PC-3 - by factors 5 to 8 higher compared to the entire peptide-toxin conjugate 8. The only slight increase of cytotoxic activity of compound 9 compared to the complete conjugate 8 in Colo320 cells is most likely caused by a generally weak responsiveness of Colo320 cells towards tubugi-1-SH and the entire conjugate tubugi-1-SS-NPY. When compared with HT-29 and PC-3 cells, the IC50 value of tubugi-1-SH is by factor 10 higher in Colo320. Since the membrane passage of tubugi-1-SH is not depending on a NPY receptor, there have to be other explanations for the reduced cytotoxic impact of tubugi-1 and corresponding derivatives in Colo320, rather than the NPY Y1 receptor expression level.
Click to Show/Hide
|
||||
| In Vitro Model | Prostate carcinoma | PC-3 cell | CVCL_0035 | ||
| Experiment 2 Reporting the Activity Data of This PDC | [1] | ||||
| Indication | Tumor | ||||
| Efficacy Data | Half Maximal Inhibitory Concentration (IC50) | 452 ± 60 nM | |||
| Description |
As shown in Table 1, the cytotoxic potency of the tubugi-1-SH was - in case of HT-29 and PC-3 - by factors 5 to 8 higher compared to the entire peptide-toxin conjugate 8. The only slight increase of cytotoxic activity of compound 9 compared to the complete conjugate 8 in Colo320 cells is most likely caused by a generally weak responsiveness of Colo320 cells towards tubugi-1-SH and the entire conjugate tubugi-1-SS-NPY. When compared with HT-29 and PC-3 cells, the IC50 value of tubugi-1-SH is by factor 10 higher in Colo320. Since the membrane passage of tubugi-1-SH is not depending on a NPY receptor, there have to be other explanations for the reduced cytotoxic impact of tubugi-1 and corresponding derivatives in Colo320, rather than the NPY Y1 receptor expression level.
Click to Show/Hide
|
||||
| In Vitro Model | Colon cancer | HT29 cell | CVCL_A8EZ | ||
| Experiment 3 Reporting the Activity Data of This PDC | [1] | ||||
| Indication | Tumor | ||||
| Efficacy Data | Half Maximal Inhibitory Concentration (IC50) | 706 ± 185 nM | |||
| Description |
As shown in Table 1, the cytotoxic potency of the tubugi-1-SH was - in case of HT-29 and PC-3 - by factors 5 to 8 higher compared to the entire peptide-toxin conjugate 8. The only slight increase of cytotoxic activity of compound 9 compared to the complete conjugate 8 in Colo320 cells is most likely caused by a generally weak responsiveness of Colo320 cells towards tubugi-1-SH and the entire conjugate tubugi-1-SS-NPY. When compared with HT-29 and PC-3 cells, the IC50 value of tubugi-1-SH is by factor 10 higher in Colo320. Since the membrane passage of tubugi-1-SH is not depending on a NPY receptor, there have to be other explanations for the reduced cytotoxic impact of tubugi-1 and corresponding derivatives in Colo320, rather than the NPY Y1 receptor expression level.
Click to Show/Hide
|
||||
| In Vitro Model | Colon adenocarcinoma | COLO 320 cell | CVCL_1989 | ||
| Experiment 4 Reporting the Activity Data of This PDC | [1] | ||||
| Indication | Tumor | ||||
| Efficacy Data | Cell viability | 0% | |||
| Administration Time | 72 h | ||||
| Administration Dosage | 10 µM | ||||
| Description |
The 72 h treatment is more effective than the 6 h pulse treatment. Notably, in vitro antitumor activities of 8 were found to correlate very good with the hY1R expression levels, as detected by gene expression analyses using RT-qPCR. Both the cytotoxic activity and the hY1R expression level rank in the order SK-N-MC > MDA-MB-468 > MDA-MB-231 > 184B5, what proofs the hY1R-specific and -selective nature of the mode of antitumor action of the designed PDC 8. Importantly, the activity of 8 against the selected normal breast cell line 184B5 is in the same order of magnitude as for the hY1R-deficient tumor cell line (MDA-MB-231), both tested at even higher concentration of the PDC than for the Y1 cell lines.
Click to Show/Hide
|
||||
| In Vitro Model | Askin tumor | SK-N-MC cell | CVCL_0530 | ||
| Experiment 5 Reporting the Activity Data of This PDC | [1] | ||||
| Indication | Tumor | ||||
| Efficacy Data | Cell viability | 2% | |||
| Administration Time | 6 h | ||||
| Administration Dosage | 10 µM | ||||
| Description |
The 72 h treatment is more effective than the 6 h pulse treatment. Notably, in vitro antitumor activities of 8 were found to correlate very good with the hY1R expression levels, as detected by gene expression analyses using RT-qPCR. Both the cytotoxic activity and the hY1R expression level rank in the order SK-N-MC > MDA-MB-468 > MDA-MB-231 > 184B5, what proofs the hY1R-specific and -selective nature of the mode of antitumor action of the designed PDC 8. Importantly, the activity of 8 against the selected normal breast cell line 184B5 is in the same order of magnitude as for the hY1R-deficient tumor cell line (MDA-MB-231), both tested at even higher concentration of the PDC than for the Y1 cell lines.
Click to Show/Hide
|
||||
| In Vitro Model | Askin tumor | SK-N-MC cell | CVCL_0530 | ||
| Experiment 6 Reporting the Activity Data of This PDC | [1] | ||||
| Indication | Tumor | ||||
| Efficacy Data | Cell viability | 5% | |||
| Administration Time | 72 h | ||||
| Administration Dosage | 10 µM | ||||
| Description |
The 72 h treatment is more effective than the 6 h pulse treatment. Notably, in vitro antitumor activities of 8 were found to correlate very good with the hY1R expression levels, as detected by gene expression analyses using RT-qPCR. Both the cytotoxic activity and the hY1R expression level rank in the order SK-N-MC > MDA-MB-468 > MDA-MB-231 > 184B5, what proofs the hY1R-specific and -selective nature of the mode of antitumor action of the designed PDC 8. Importantly, the activity of 8 against the selected normal breast cell line 184B5 is in the same order of magnitude as for the hY1R-deficient tumor cell line (MDA-MB-231), both tested at even higher concentration of the PDC than for the Y1 cell lines.
Click to Show/Hide
|
||||
| In Vitro Model | Breast adenocarcinoma | MDA-MB-468 cell | CVCL_0419 | ||
| Experiment 7 Reporting the Activity Data of This PDC | [1] | ||||
| Indication | Tumor | ||||
| Efficacy Data | Cell viability | 10% | |||
| Administration Time | 6 h | ||||
| Administration Dosage | 10 µM | ||||
| Description |
The 72 h treatment is more effective than the 6 h pulse treatment. Notably, in vitro antitumor activities of 8 were found to correlate very good with the hY1R expression levels, as detected by gene expression analyses using RT-qPCR. Both the cytotoxic activity and the hY1R expression level rank in the order SK-N-MC > MDA-MB-468 > MDA-MB-231 > 184B5, what proofs the hY1R-specific and -selective nature of the mode of antitumor action of the designed PDC 8. Importantly, the activity of 8 against the selected normal breast cell line 184B5 is in the same order of magnitude as for the hY1R-deficient tumor cell line (MDA-MB-231), both tested at even higher concentration of the PDC than for the Y1 cell lines.
Click to Show/Hide
|
||||
| In Vitro Model | Breast adenocarcinoma | MDA-MB-468 cell | CVCL_0419 | ||
| Experiment 8 Reporting the Activity Data of This PDC | [1] | ||||
| Indication | Tumor | ||||
| Efficacy Data | Cell viability | 20% | |||
| Administration Time | 72 h | ||||
| Administration Dosage | 10 µM | ||||
| Description |
The 72 h treatment is more effective than the 6 h pulse treatment. Notably, in vitro antitumor activities of 8 were found to correlate very good with the hY1R expression levels, as detected by gene expression analyses using RT-qPCR. Both the cytotoxic activity and the hY1R expression level rank in the order SK-N-MC > MDA-MB-468 > MDA-MB-231 > 184B5, what proofs the hY1R-specific and -selective nature of the mode of antitumor action of the designed PDC 8. Importantly, the activity of 8 against the selected normal breast cell line 184B5 is in the same order of magnitude as for the hY1R-deficient tumor cell line (MDA-MB-231), both tested at even higher concentration of the PDC than for the Y1 cell lines.
Click to Show/Hide
|
||||
| In Vitro Model | Breast adenocarcinoma | MDA-MB-231 cell | CVCL_0062 | ||
| Experiment 9 Reporting the Activity Data of This PDC | [1] | ||||
| Indication | Tumor | ||||
| Efficacy Data | Cell viability | 20% | |||
| Administration Time | 72 h | ||||
| Administration Dosage | 10 µM | ||||
| Description |
The 72 h treatment is more effective than the 6 h pulse treatment. Notably, in vitro antitumor activities of 8 were found to correlate very good with the hY1R expression levels, as detected by gene expression analyses using RT-qPCR. Both the cytotoxic activity and the hY1R expression level rank in the order SK-N-MC > MDA-MB-468 > MDA-MB-231 > 184B5, what proofs the hY1R-specific and -selective nature of the mode of antitumor action of the designed PDC 8. Importantly, the activity of 8 against the selected normal breast cell line 184B5 is in the same order of magnitude as for the hY1R-deficient tumor cell line (MDA-MB-231), both tested at even higher concentration of the PDC than for the Y1 cell lines.
Click to Show/Hide
|
||||
| In Vitro Model | Normal | Normal mammary gland epithelium | Homo sapiens | ||
| Experiment 10 Reporting the Activity Data of This PDC | [1] | ||||
| Indication | Tumor | ||||
| Efficacy Data | Cell viability | 35% | |||
| Administration Time | 6 h | ||||
| Administration Dosage | 10 µM | ||||
| Description |
The 72 h treatment is more effective than the 6 h pulse treatment. Notably, in vitro antitumor activities of 8 were found to correlate very good with the hY1R expression levels, as detected by gene expression analyses using RT-qPCR. Both the cytotoxic activity and the hY1R expression level rank in the order SK-N-MC > MDA-MB-468 > MDA-MB-231 > 184B5, what proofs the hY1R-specific and -selective nature of the mode of antitumor action of the designed PDC 8. Importantly, the activity of 8 against the selected normal breast cell line 184B5 is in the same order of magnitude as for the hY1R-deficient tumor cell line (MDA-MB-231), both tested at even higher concentration of the PDC than for the Y1 cell lines.
Click to Show/Hide
|
||||
| In Vitro Model | Breast adenocarcinoma | MDA-MB-231 cell | CVCL_0062 | ||
| Experiment 11 Reporting the Activity Data of This PDC | [1] | ||||
| Indication | Tumor | ||||
| Efficacy Data | Cell viability | 50% | |||
| Administration Time | 6 h | ||||
| Administration Dosage | 10 µM | ||||
| Description |
The 72 h treatment is more effective than the 6 h pulse treatment. Notably, in vitro antitumor activities of 8 were found to correlate very good with the hY1R expression levels, as detected by gene expression analyses using RT-qPCR. Both the cytotoxic activity and the hY1R expression level rank in the order SK-N-MC > MDA-MB-468 > MDA-MB-231 > 184B5, what proofs the hY1R-specific and -selective nature of the mode of antitumor action of the designed PDC 8. Importantly, the activity of 8 against the selected normal breast cell line 184B5 is in the same order of magnitude as for the hY1R-deficient tumor cell line (MDA-MB-231), both tested at even higher concentration of the PDC than for the Y1 cell lines.
Click to Show/Hide
|
||||
| In Vitro Model | Normal | Normal mammary gland epithelium | Homo sapiens | ||
References