Linker Information
General Information of This Linker
| Linker ID |
LIN00059
|
|||||
|---|---|---|---|---|---|---|
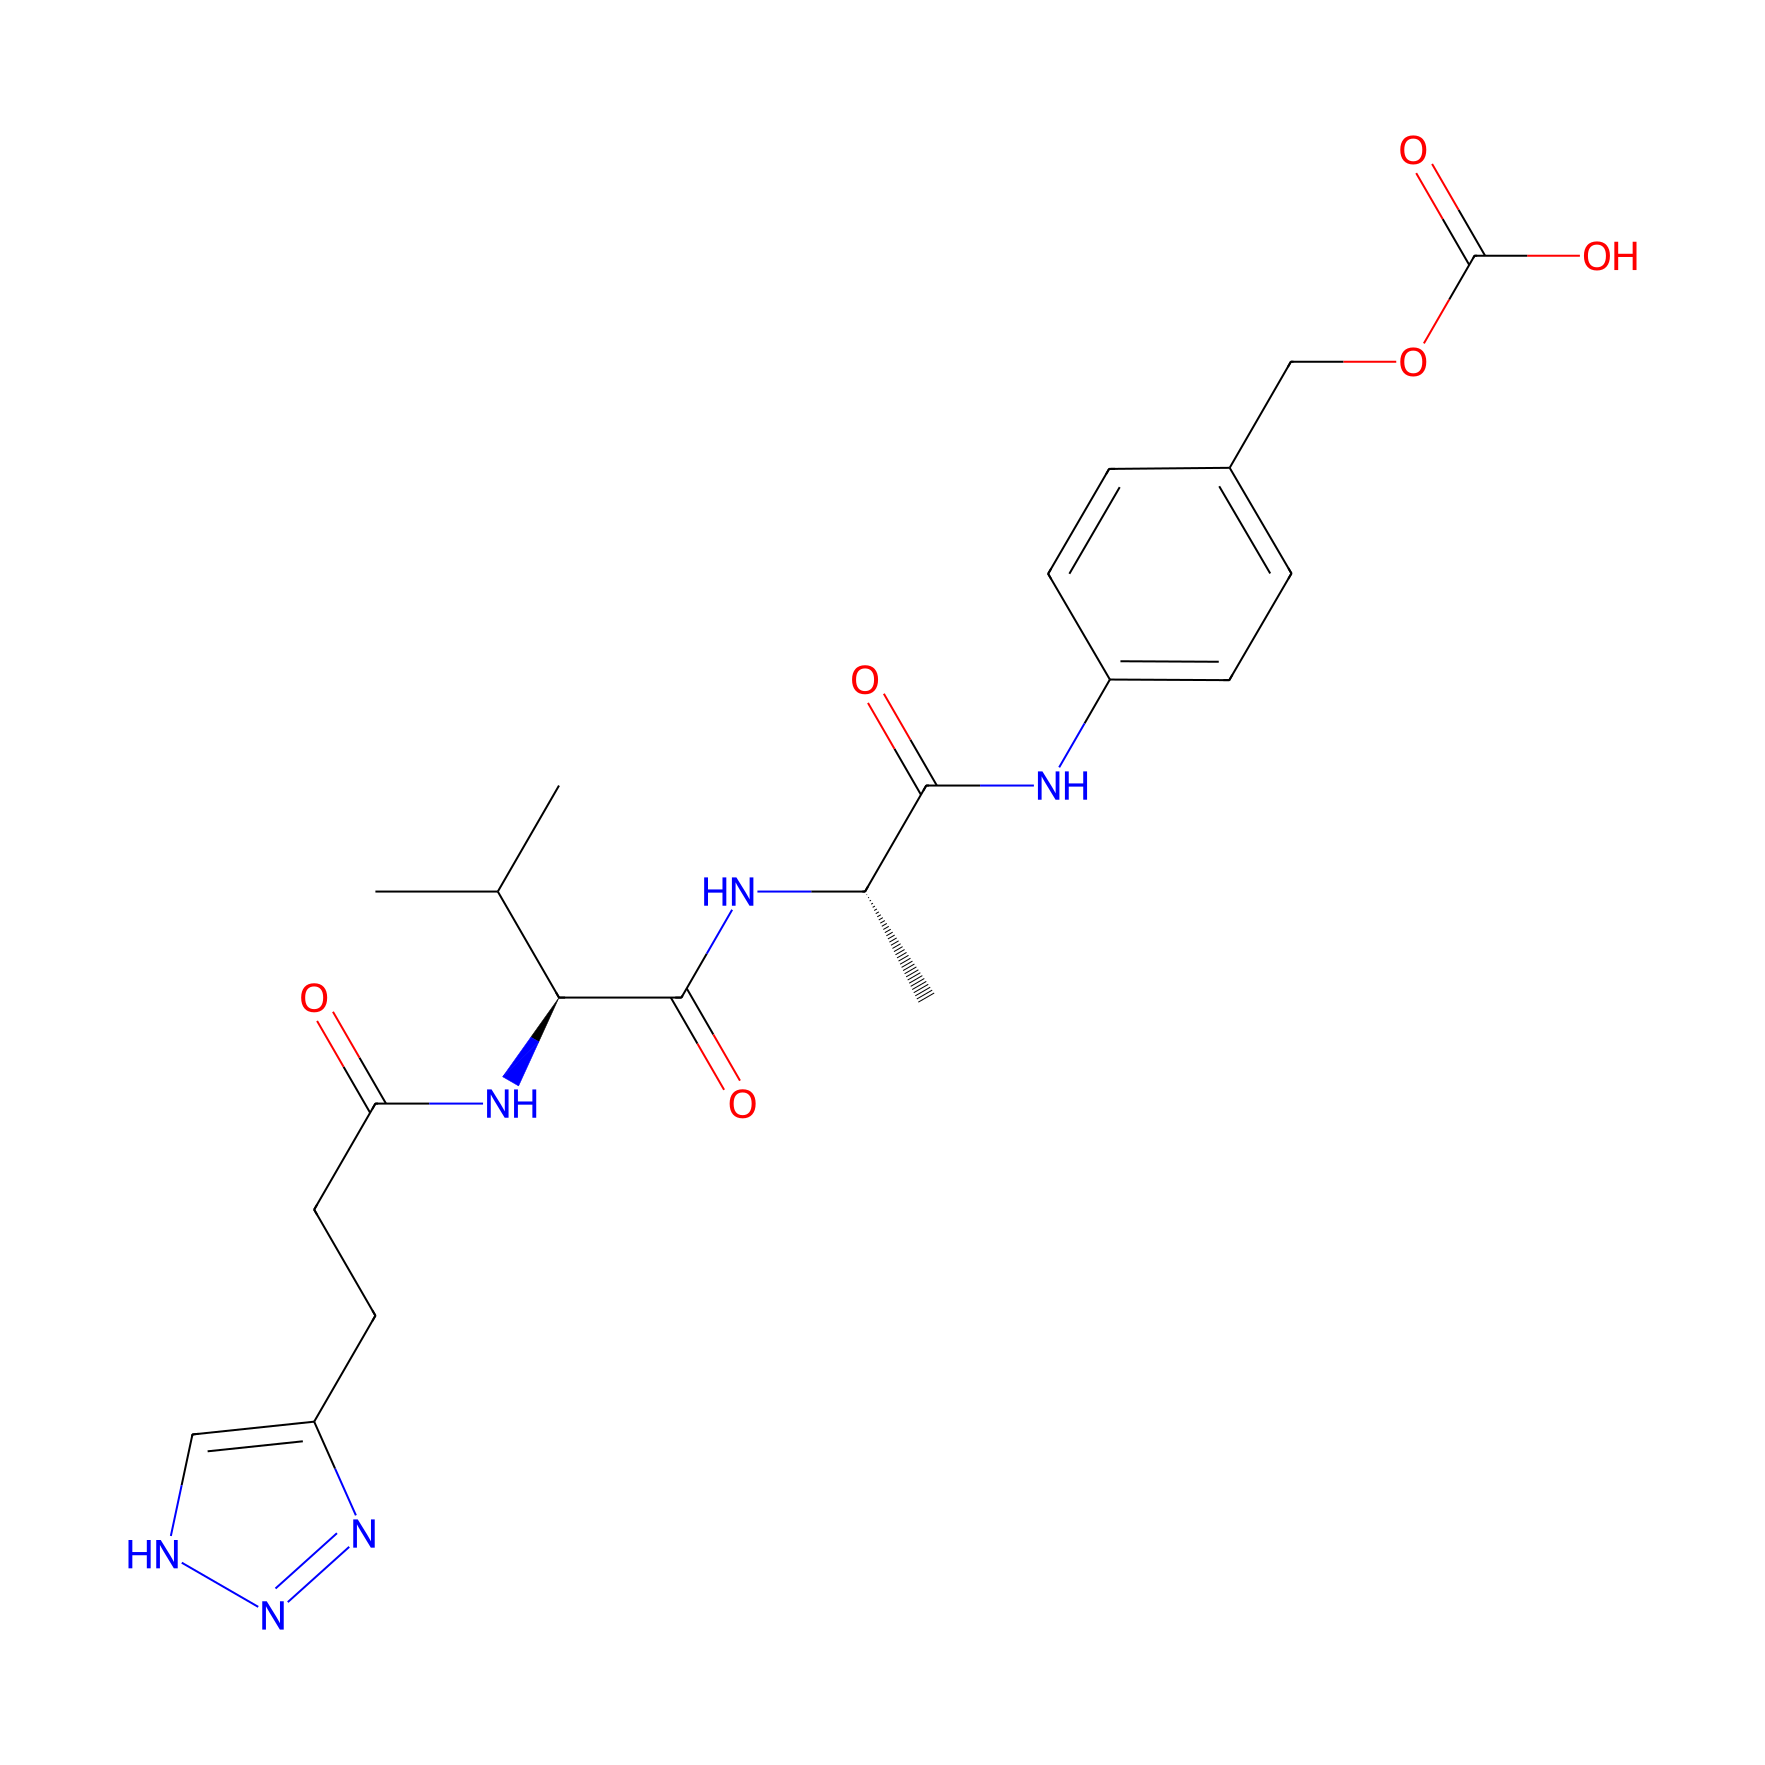
| Linker Name |
rac-4-((R)-2-((R)-2-(3-(1H-1,2,3-triazol-4-yl)propanamido)-3-methylbutanamido)propanamido)benzyl hydrogen carbonate
|
|||||
| Linker Type |
Enzyme-sensitive linkers
|
|||||
| Structure |
|
|||||
| Formula |
C21H28N6O6
|
|||||
| #Ro5 Violations (Lipinski): 1 | Molecular Weight (mw) | 460.491 | ||||
| Lipid-water partition coefficient (xlogp) | 1.2161 | |||||
| Hydrogen Bond Donor Count (hbonddonor) | 5 | |||||
| Hydrogen Bond Acceptor Count (hbondacc) | 7 | |||||
| Rotatable Bond Count (rotbonds) | 11 | |||||
| Canonical smiles |
CC(NC(=O)C(NC(=O)CCc1c[nH]nn1)C(C)C)C(=O)Nc1ccc(COC(=O)O)cc1
|
|||||
| InChI |
InChI=1S/C21H28N6O6/c1-12(2)18(25-17(28)9-8-16-10-22-27-26-16)20(30)23-13(3)19(29)24-15-6-4-14(5-7-15)11-33-21(31)32/h4-7,10,12-13,18H,8-9,11H2,1-3H3,(H,23,30)(H,24,29)(H,25,28)(H,31,32)(H,22,26,27)/t13-,18-/m0/s1
|
|||||
| InChIKey |
RFGHENNUYMVFQH-UGSOOPFHSA-N
|
|||||
Each Peptide-drug Conjugate Related to This Linker
Full Information of The Activity Data of The PDC(s) Related to This Linker
EETI-2.5Z-Val-Ala-PAB-gemcitabine [Investigative]
Revealed Based on the Cell Line Data
| Experiment 1 Reporting the Activity Data of This PDC | [1] | ||||
| Indication | Glioblastoma | ||||
| Efficacy Data | Half Maximal Inhibitory Concentration (IC50) |
1.5 ± 0.2 nM
|
|||
| Evaluation Method | CCK-8 assay | ||||
| Description |
Cell proliferation was quantified 4 d after treatment with each compoundusing CCK-8 colorimetric assays and compared to the untreated control.
|
||||
| In Vitro Model | Glioblastoma | U-87MG cell | CVCL_0022 | ||
| Experiment 2 Reporting the Activity Data of This PDC | [1] | ||||
| Indication | Breast cancer | ||||
| Efficacy Data | Half Maximal Effective Concentration (EC50) |
0.6 ± 0.1 nM
|
|||
| Evaluation Method | CCK-8 assay | ||||
| Description |
Cell proliferation was quantified 4 d after treatment with 5 d or 3 using CCK-8 colorimetric assays and compared to the untreated control. Metabolic activity measured by CCK-8 was validated by quantifying celldeath using Trypan Blue.
|
||||
| In Vitro Model | Breast adenocarcinoma | MDA-MB-468 cell | CVCL_0419 | ||
| Experiment 3 Reporting the Activity Data of This PDC | [1] | ||||
| Indication | Pancreatic cancer | ||||
| Efficacy Data | Half Maximal Effective Concentration (EC50) |
1.8 ± 0.8 nM
|
|||
| Evaluation Method | CCK-8 assay | ||||
| Description |
Cell proliferation was quantified 4 d after treatment with 5 d or 3 using CCK-8 colorimetric assays and compared to the untreated control. Metabolic activity measured by CCK-8 was validated by quantifying celldeath using Trypan Blue.
|
||||
| In Vitro Model | Pancreatic ductal adenocarcinoma | BxPC-3 cell | CVCL_0186 | ||
| Experiment 4 Reporting the Activity Data of This PDC | [1] | ||||
| Indication | Pancreatic cancer | ||||
| Efficacy Data | Half Maximal Effective Concentration (EC50) |
2.1 ± 0.2 nM
|
|||
| Evaluation Method | CCK-8 assay | ||||
| Description |
Cell proliferation was quantified 4 d after treatment with 5 d or 3 using CCK-8 colorimetric assays and compared to the untreated control. Metabolic activity measured by CCK-8 was validated by quantifying celldeath using Trypan Blue.
|
||||
| In Vitro Model | Pancreatic ductal adenocarcinoma | PANC-1 cell | CVCL_0480 | ||
| Experiment 5 Reporting the Activity Data of This PDC | [1] | ||||
| Indication | Ovarian cancer | ||||
| Efficacy Data | Half Maximal Effective Concentration (EC50) |
2.3 ± 0.5 nM
|
|||
| Evaluation Method | CCK-8 assay | ||||
| Description |
Cell proliferation was quantified 4 d after treatment with 5 d or 3 using CCK-8 colorimetric assays and compared to the untreated control. Metabolic activity measured by CCK-8 was validated by quantifying celldeath using Trypan Blue.
|
||||
| In Vitro Model | Ovarian endometrioid adenocarcinoma | A2780 cell | CVCL_0134 | ||
| Experiment 6 Reporting the Activity Data of This PDC | [1] | ||||
| Indication | Glioblastoma | ||||
| Efficacy Data | Half Maximal Effective Concentration (EC50) |
7.9 ± 0.8 nM
|
|||
| Evaluation Method | CCK-8 assay | ||||
| Description |
Cell proliferation was quantified 4 d after treatment with 5 d or 3 using CCK-8 colorimetric assays and compared to the untreated control. Metabolic activity measured by CCK-8 was validated by quantifying celldeath using Trypan Blue.
|
||||
| In Vitro Model | Glioblastoma | D-270MG cell | CVCL_S751 | ||
| Experiment 7 Reporting the Activity Data of This PDC | [1] | ||||
| Indication | Glioblastoma | ||||
| Efficacy Data | Half Maximal Effective Concentration (EC50) |
9.0 ± 1.8 nM
|
|||
| Evaluation Method | CCK-8 assay | ||||
| Description |
Cell proliferation was quantified 4 d after treatment with 5 d or 3 using CCK-8 colorimetric assays and compared to the untreated control. Metabolic activity measured by CCK-8 was validated by quantifying celldeath using Trypan Blue.
|
||||
| In Vitro Model | Glioblastoma | U-87MG cell | CVCL_0022 | ||
References