Peptide-drug Conjugate Information
General Information of This Peptide-drug Conjugate (PDC)
| PDC ID |
PDC_00149
|
|||||
|---|---|---|---|---|---|---|
| PDC Name |
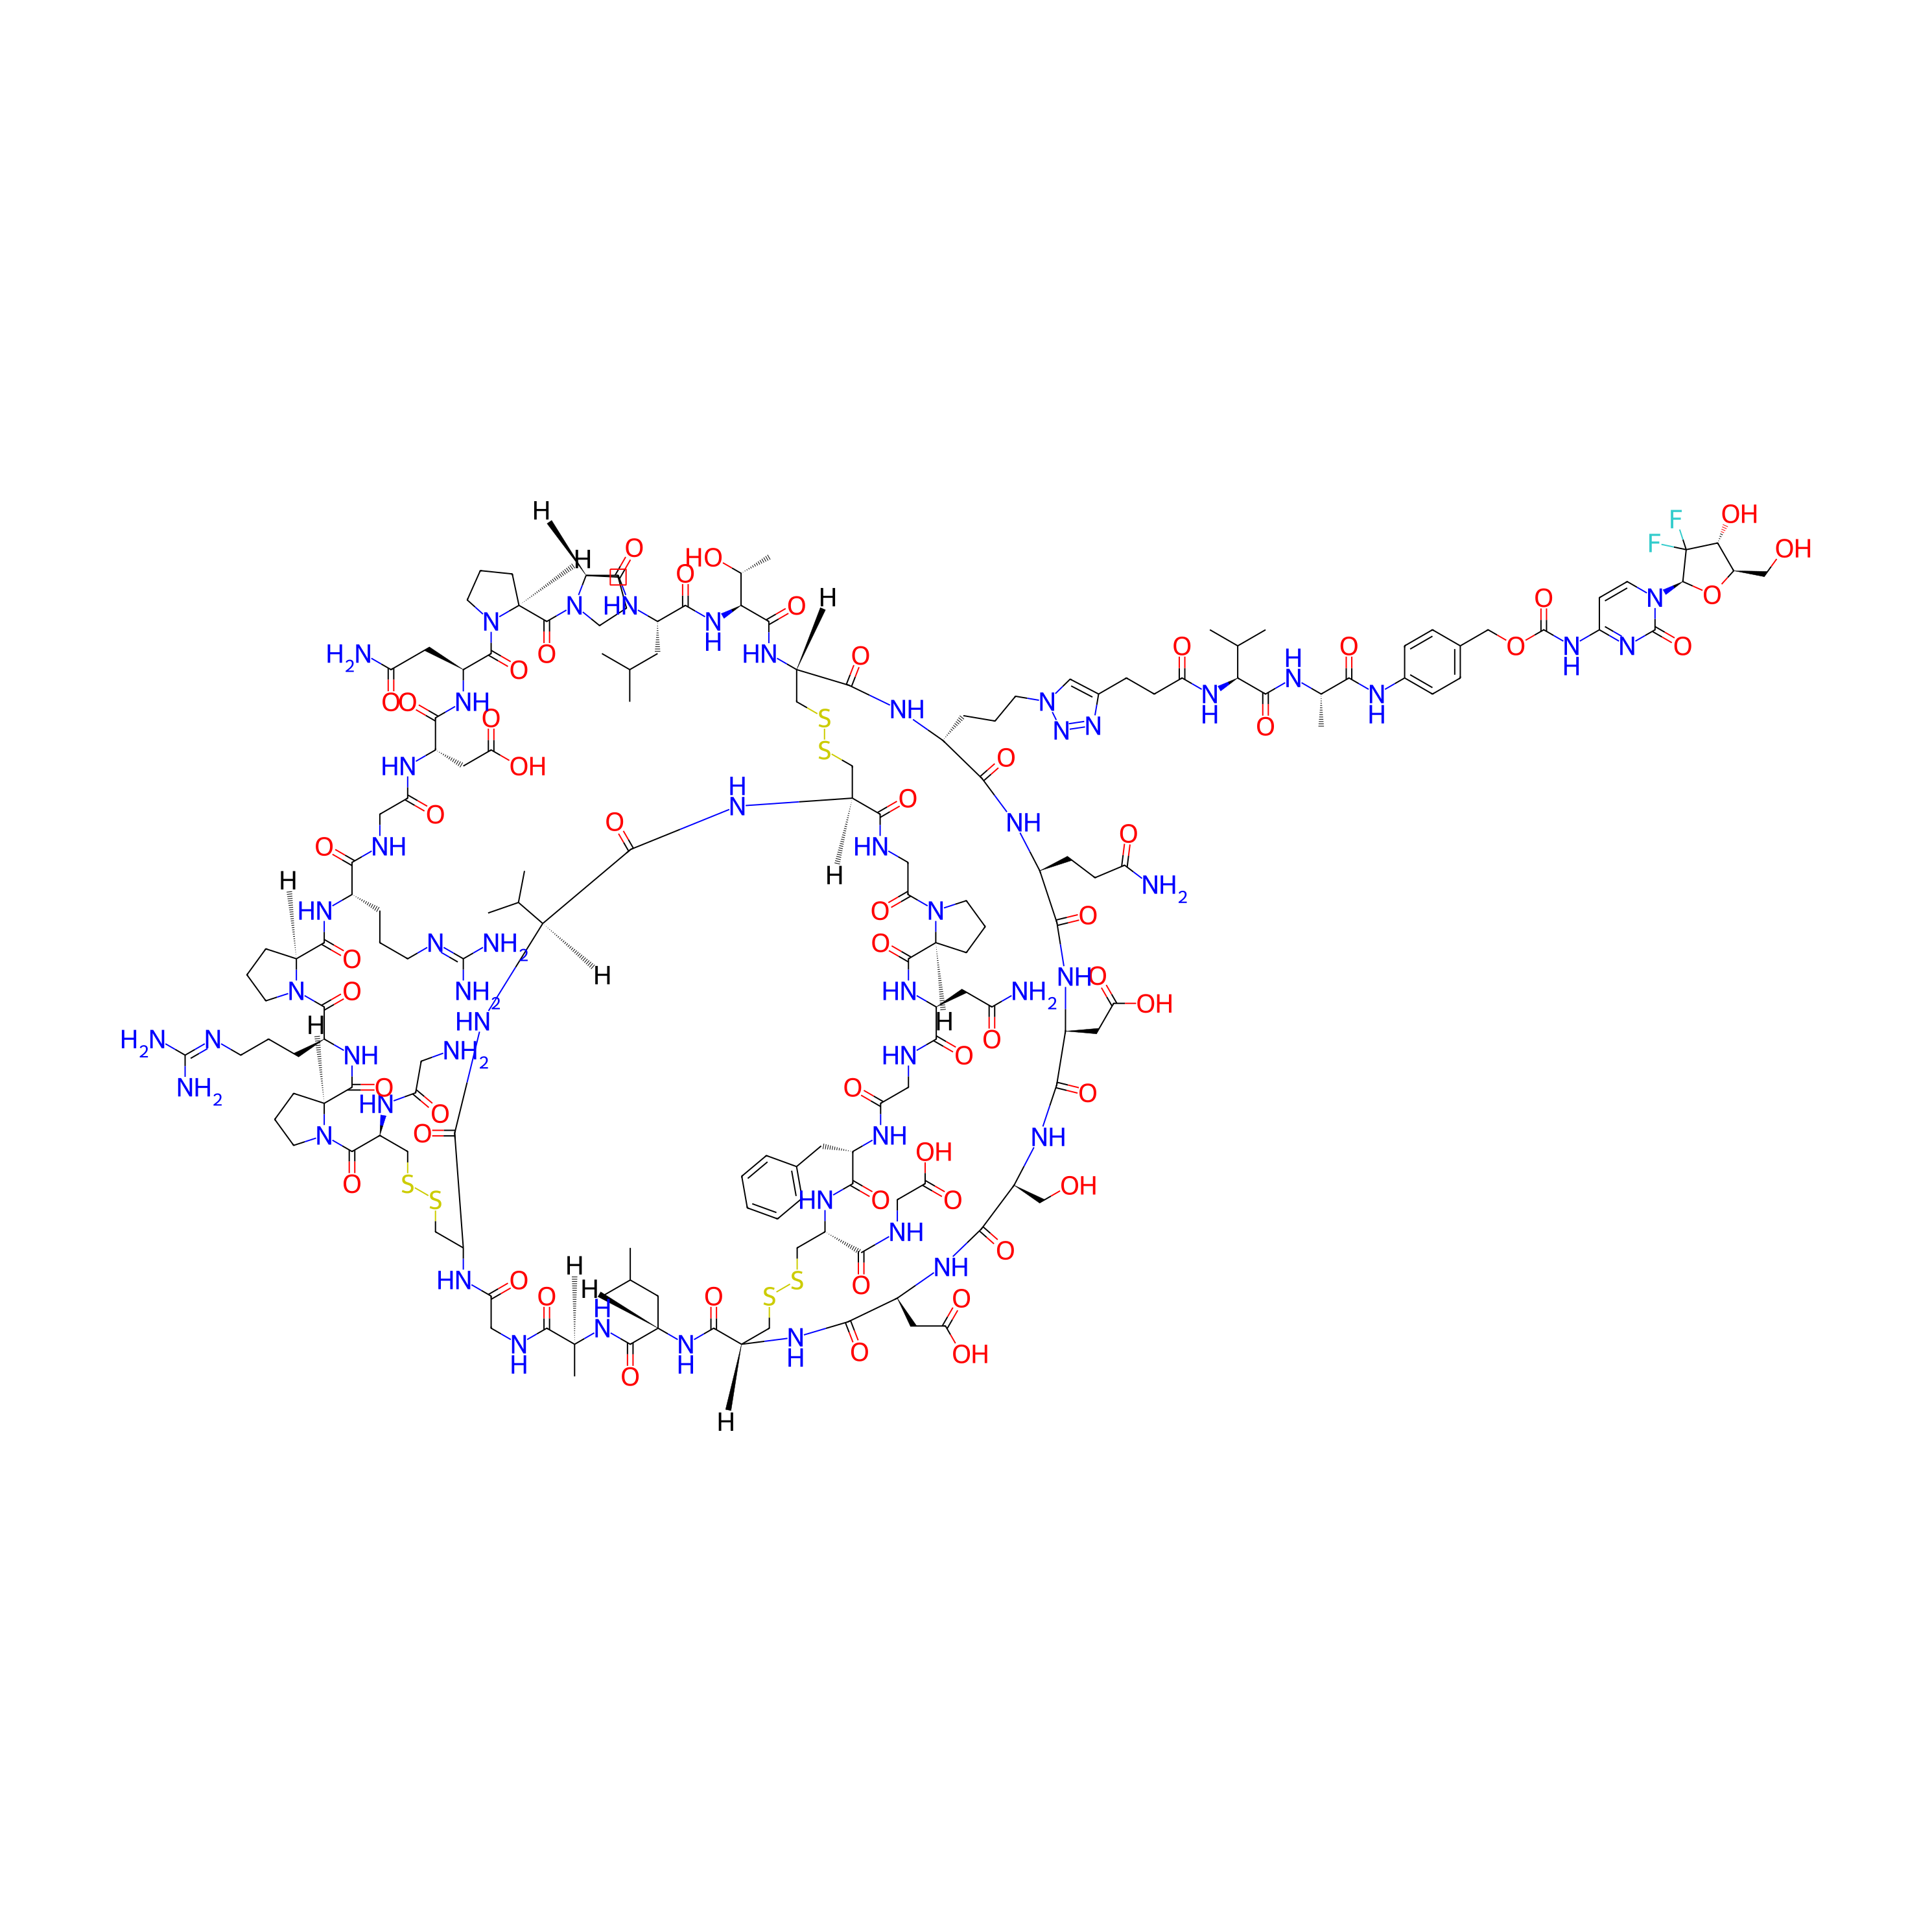
EETI-2.5Z-Val-Ala-PAB-gemcitabine
|
|||||
| PDC Status |
Investigative
|
|||||
| Indication |
In total 4 Indication(s)
|
|||||
| Structure |
|
|||||
| Peptide Name |
EETI-2.5Z
|
Peptide Info | ||||
| Receptor Name |
Integrin
|
Receptor Info | ||||
| Drug Name |
Gemcitabine
|
Drug Info | ||||
| Therapeutic Target |
Ribonucleoside-diphosphate reductase subunit M2 (RRM2)
|
Target Info | ||||
| Linker Name |
rac-4-((R)-2-((R)-2-(3-(1H-1,2,3-triazol-4-yl)propanamido)-3-methylbutanamido)propanamido)benzyl hydrogen carbonate
|
Linker Info | ||||
| Peptide Modified Type |
Amino acid modifications; Cyclization modification
|
|||||
| Modified Segment |
Cyclization modification
|
|||||
| Formula |
C163H239F2N51O54S6
|
|||||
| #Ro5 Violations (Lipinski): 5 | Molecular Weight | 4007.406 | ||||
| Lipid-water partition coefficient (xlogp) | -19.1722 | |||||
| Hydrogen Bond Donor Count (hbonddonor) | 47 | |||||
| Hydrogen Bond Acceptor Count (hbondacc) | 64 | |||||
| Rotatable Bond Count (rotbonds) | 53 | |||||
Full List of Activity Data of This Peptide-drug Conjugate
Revealed Based on the Cell Line Data
| Experiment 1 Reporting the Activity Data of This PDC | [1] | ||||
| Indication | Breast cancer | ||||
| Efficacy Data | Half Maximal Effective Concentration (EC50) |
0.6 ± 0.1 nM
|
|||
| Evaluation Method | CCK-8 assay | ||||
| Description |
Cell proliferation was quantified 4 d after treatment with 5 d or 3 using CCK-8 colorimetric assays and compared to the untreated control. Metabolic activity measured by CCK-8 was validated by quantifying celldeath using Trypan Blue.
|
||||
| In Vitro Model | Breast adenocarcinoma | MDA-MB-468 cell | CVCL_0419 | ||
| Experiment 2 Reporting the Activity Data of This PDC | [1] | ||||
| Indication | Pancreatic cancer | ||||
| Efficacy Data | Half Maximal Effective Concentration (EC50) |
1.8 ± 0.8 nM
|
|||
| Evaluation Method | CCK-8 assay | ||||
| Description |
Cell proliferation was quantified 4 d after treatment with 5 d or 3 using CCK-8 colorimetric assays and compared to the untreated control. Metabolic activity measured by CCK-8 was validated by quantifying celldeath using Trypan Blue.
|
||||
| In Vitro Model | Pancreatic ductal adenocarcinoma | BxPC-3 cell | CVCL_0186 | ||
| Experiment 3 Reporting the Activity Data of This PDC | [1] | ||||
| Indication | Pancreatic cancer | ||||
| Efficacy Data | Half Maximal Effective Concentration (EC50) |
2.1 ± 0.2 nM
|
|||
| Evaluation Method | CCK-8 assay | ||||
| Description |
Cell proliferation was quantified 4 d after treatment with 5 d or 3 using CCK-8 colorimetric assays and compared to the untreated control. Metabolic activity measured by CCK-8 was validated by quantifying celldeath using Trypan Blue.
|
||||
| In Vitro Model | Pancreatic ductal adenocarcinoma | PANC-1 cell | CVCL_0480 | ||
| Experiment 4 Reporting the Activity Data of This PDC | [1] | ||||
| Indication | Ovarian cancer | ||||
| Efficacy Data | Half Maximal Effective Concentration (EC50) |
2.3 ± 0.5 nM
|
|||
| Evaluation Method | CCK-8 assay | ||||
| Description |
Cell proliferation was quantified 4 d after treatment with 5 d or 3 using CCK-8 colorimetric assays and compared to the untreated control. Metabolic activity measured by CCK-8 was validated by quantifying celldeath using Trypan Blue.
|
||||
| In Vitro Model | Ovarian endometrioid adenocarcinoma | A2780 cell | CVCL_0134 | ||
| Experiment 5 Reporting the Activity Data of This PDC | [1] | ||||
| Indication | Glioblastoma | ||||
| Efficacy Data | Half Maximal Effective Concentration (EC50) |
7.9 ± 0.8 nM
|
|||
| Evaluation Method | CCK-8 assay | ||||
| Description |
Cell proliferation was quantified 4 d after treatment with 5 d or 3 using CCK-8 colorimetric assays and compared to the untreated control. Metabolic activity measured by CCK-8 was validated by quantifying celldeath using Trypan Blue.
|
||||
| In Vitro Model | Glioblastoma | D-270MG cell | CVCL_S751 | ||
| Experiment 6 Reporting the Activity Data of This PDC | [1] | ||||
| Indication | Glioblastoma | ||||
| Efficacy Data | Half Maximal Effective Concentration (EC50) |
9.0 ± 1.8 nM
|
|||
| Evaluation Method | CCK-8 assay | ||||
| Description |
Cell proliferation was quantified 4 d after treatment with 5 d or 3 using CCK-8 colorimetric assays and compared to the untreated control. Metabolic activity measured by CCK-8 was validated by quantifying celldeath using Trypan Blue.
|
||||
| In Vitro Model | Glioblastoma | U-87MG cell | CVCL_0022 | ||
| Experiment 7 Reporting the Activity Data of This PDC | [1] | ||||
| Indication | Glioblastoma | ||||
| Efficacy Data | Half Maximal Inhibitory Concentration (IC50) |
1.5 ± 0.2 nM
|
|||
| Evaluation Method | CCK-8 assay | ||||
| Description |
Cell proliferation was quantified 4 d after treatment with each compoundusing CCK-8 colorimetric assays and compared to the untreated control.
|
||||
| In Vitro Model | Glioblastoma | U-87MG cell | CVCL_0022 | ||
References