Peptide Information
General Information of This Peptide
| Peptide ID |
PEP00040
|
|||||
|---|---|---|---|---|---|---|
| Peptide Name |
EETI-2.5Z
|
|||||
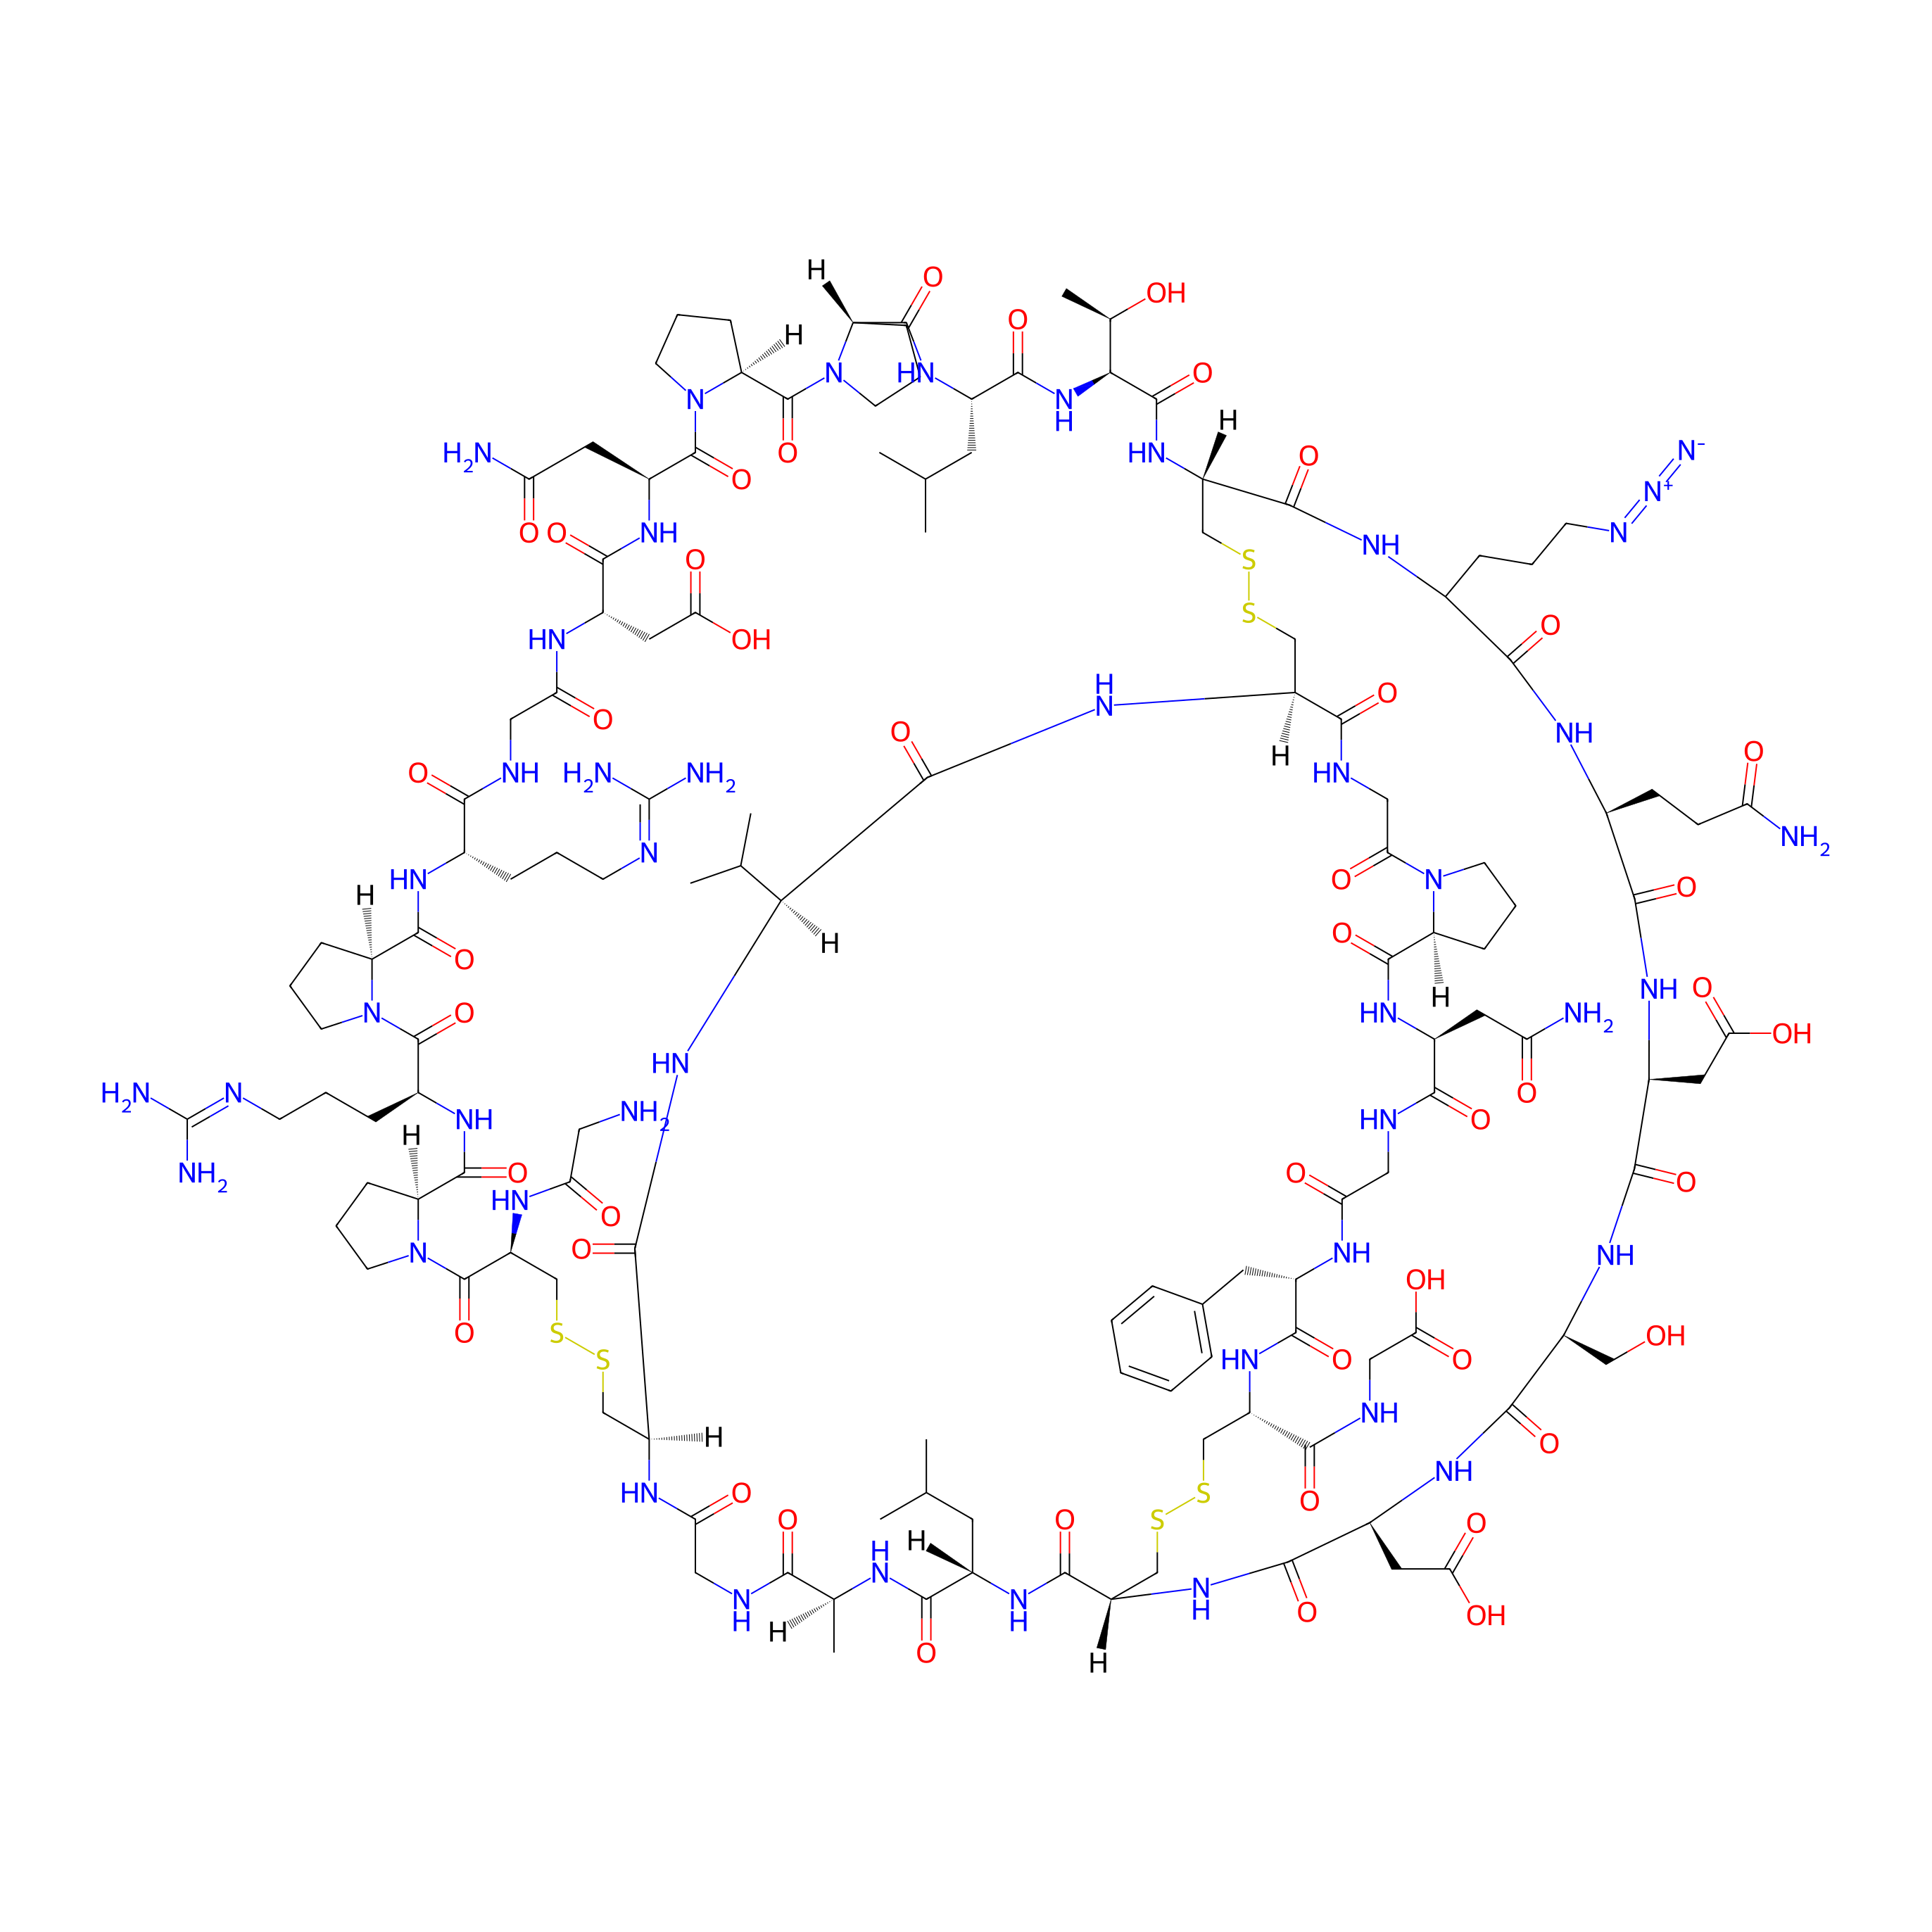
| Structure |
|
|||||
| Sequence |
GCPRPRGDNPPLTC-5-azido-L-norvaline-QDSDCLAGCVCGPNGFCG
|
|||||
| Peptide Type |
Cyclic
|
|||||
| Receptor Name |
Integrin
|
Receptor Info | ||||
| PDC Transmembrane Types | Cell targeting peptides (CTPs) | |||||
| Formula |
C133H203N45O45S6
|
|||||
| Isosmiles |
[H]NCC(=O)N[C@H]1CSSC[C@@H]2NC(=O)CNC(=O)[C@H](C)NC(=O)[C@H](CC(C)C)NC(=O)[C@@H]3CSSC[C@@H](C(=O)NCC(=O)O)NC(=O)[C@H](Cc4ccccc4)NC(=O)CNC(=O)[C@H](CC(=O)N[H])NC(=O)[C@@H]4CCCN4C(=O)CNC(=O)[C@H](CSSC[C@H](NC(=O)[C@]([H])([C@@H](C)O[H])NC(=O)[C@H](CC(C)C)NC(=O)[C@@H]4CCCN4C(=O)[C@@H]4CCCN4C(=O)[C@H](CC(=O)N[H])NC(=O)[C@H](CC(=O)O)NC(=O)CNC(=O)[C@H](CCC/N=C(\N)N[H])NC(=O)[C@@H]4CCCN4C(=O)[C@H](CCC/N=C(\N)N[H])NC(=O)[C@@H]4CCCN4C1=O)C(=O)NC(CCCN=[N+]=[N-])C(=O)N[C@@H](CCC(=O)N[H])C(=O)N[C@@H](CC(=O)O)C(=O)N[C@@H](CO[H])C(=O)N[C@@H](CC(=O)O)C(=O)N3)NC(=O)[C@H](C(C)C)NC2=O
|
|||||
| InChI |
InChI=1S/C133H203N45O45S6/c1-61(2)40-71-112(204)151-64(7)105(197)145-49-97(187)154-82-57-226-229-60-85(155-94(184)48-134)130(222)176-37-17-27-88(176)124(216)159-70(24-13-33-144-133(140)141)128(220)175-36-16-26-87(175)123(215)158-67(22-12-32-143-132(138)139)106(198)146-50-96(186)153-75(45-99(189)190)114(206)165-78(44-93(137)183)129(221)178-39-19-29-90(178)131(223)177-38-18-28-89(177)125(217)163-72(41-62(3)4)117(209)172-104(65(8)180)127(219)170-84-59-228-225-56-81(169-126(218)103(63(5)6)171-121(82)213)108(200)148-52-98(188)174-35-15-25-86(174)122(214)164-74(43-92(136)182)107(199)147-51-95(185)152-73(42-66-20-10-9-11-21-66)113(205)167-80(109(201)149-53-102(195)196)55-224-227-58-83(120(212)160-71)168-116(208)77(47-101(193)194)162-118(210)79(54-179)166-115(207)76(46-100(191)192)161-111(203)69(30-31-91(135)181)157-110(202)68(156-119(84)211)23-14-34-150-173-142/h9-11,20-21,61-65,67-90,103-104,179-180H,12-19,22-60,134H2,1-8H3,(H2,135,181)(H2,136,182)(H2,137,183)(H,145,197)(H,146,198)(H,147,199)(H,148,200)(H,149,201)(H,151,204)(H,152,185)(H,153,186)(H,154,187)(H,155,184)(H,156,211)(H,157,202)(H,158,215)(H,159,216)(H,160,212)(H,161,203)(H,162,210)(H,163,217)(H,164,214)(H,165,206)(H,166,207)(H,167,205)(H,168,208)(H,169,218)(H,170,219)(H,171,213)(H,172,209)(H,189,190)(H,191,192)(H,193,194)(H,195,196)(H4,138,139,143)(H4,140,141,144)/t64-,65+,67-,68?,69-,70-,71-,72-,73-,74-,75-,76-,77-,78-,79-,80-,81-,82-,83-,84-,85-,86-,87-,88-,89-,90-,103-,104-/m0/s1
|
|||||
| InChIKey |
BSHOIAHSRSHKEB-NFKDFXAISA-N
|
|||||
| Pharmaceutical Properties |
Molecule Weight
|
3344.759
|
Polar area
|
1409.76
|
||
|
Complexity
|
3342.330395
|
xlogp Value
|
-18.5617
|
|||
|
Heavy Count
|
229
|
Rot Bonds
|
42
|
|||
|
Hbond acc
|
51
|
Hbond Donor
|
41
|
|||
The Activity Data of This Peptide
| Peptide Activity Information 1 | [1] | |||||
| IC50 | 1.1 ± 0.2 nM | |||||
|---|---|---|---|---|---|---|
| Experimental Condition | U87MG cell | |||||
Each Peptide-drug Conjugate Related to This Peptide
Full Information of The Activity Data of The PDC(s) Related to This Peptide
EETI-2.5Z-Val-Ala-PAB-gemcitabine [Investigative]
Revealed Based on the Cell Line Data
| Experiment 1 Reporting the Activity Data of This PDC | [1] | ||||
| Indication | Glioblastoma | ||||
| Efficacy Data | Half Maximal Inhibitory Concentration (IC50) |
1.5 ± 0.2 nM
|
|||
| Evaluation Method | CCK-8 assay | ||||
| Description |
Cell proliferation was quantified 4 d after treatment with each compoundusing CCK-8 colorimetric assays and compared to the untreated control.
|
||||
| In Vitro Model | Glioblastoma | U-87MG cell | CVCL_0022 | ||
| Experiment 2 Reporting the Activity Data of This PDC | [1] | ||||
| Indication | Breast cancer | ||||
| Efficacy Data | Half Maximal Effective Concentration (EC50) |
0.6 ± 0.1 nM
|
|||
| Evaluation Method | CCK-8 assay | ||||
| Description |
Cell proliferation was quantified 4 d after treatment with 5 d or 3 using CCK-8 colorimetric assays and compared to the untreated control. Metabolic activity measured by CCK-8 was validated by quantifying celldeath using Trypan Blue.
|
||||
| In Vitro Model | Breast adenocarcinoma | MDA-MB-468 cell | CVCL_0419 | ||
| Experiment 3 Reporting the Activity Data of This PDC | [1] | ||||
| Indication | Pancreatic cancer | ||||
| Efficacy Data | Half Maximal Effective Concentration (EC50) |
1.8 ± 0.8 nM
|
|||
| Evaluation Method | CCK-8 assay | ||||
| Description |
Cell proliferation was quantified 4 d after treatment with 5 d or 3 using CCK-8 colorimetric assays and compared to the untreated control. Metabolic activity measured by CCK-8 was validated by quantifying celldeath using Trypan Blue.
|
||||
| In Vitro Model | Pancreatic ductal adenocarcinoma | BxPC-3 cell | CVCL_0186 | ||
| Experiment 4 Reporting the Activity Data of This PDC | [1] | ||||
| Indication | Pancreatic cancer | ||||
| Efficacy Data | Half Maximal Effective Concentration (EC50) |
2.1 ± 0.2 nM
|
|||
| Evaluation Method | CCK-8 assay | ||||
| Description |
Cell proliferation was quantified 4 d after treatment with 5 d or 3 using CCK-8 colorimetric assays and compared to the untreated control. Metabolic activity measured by CCK-8 was validated by quantifying celldeath using Trypan Blue.
|
||||
| In Vitro Model | Pancreatic ductal adenocarcinoma | PANC-1 cell | CVCL_0480 | ||
| Experiment 5 Reporting the Activity Data of This PDC | [1] | ||||
| Indication | Ovarian cancer | ||||
| Efficacy Data | Half Maximal Effective Concentration (EC50) |
2.3 ± 0.5 nM
|
|||
| Evaluation Method | CCK-8 assay | ||||
| Description |
Cell proliferation was quantified 4 d after treatment with 5 d or 3 using CCK-8 colorimetric assays and compared to the untreated control. Metabolic activity measured by CCK-8 was validated by quantifying celldeath using Trypan Blue.
|
||||
| In Vitro Model | Ovarian endometrioid adenocarcinoma | A2780 cell | CVCL_0134 | ||
| Experiment 6 Reporting the Activity Data of This PDC | [1] | ||||
| Indication | Glioblastoma | ||||
| Efficacy Data | Half Maximal Effective Concentration (EC50) |
7.9 ± 0.8 nM
|
|||
| Evaluation Method | CCK-8 assay | ||||
| Description |
Cell proliferation was quantified 4 d after treatment with 5 d or 3 using CCK-8 colorimetric assays and compared to the untreated control. Metabolic activity measured by CCK-8 was validated by quantifying celldeath using Trypan Blue.
|
||||
| In Vitro Model | Glioblastoma | D-270MG cell | CVCL_S751 | ||
| Experiment 7 Reporting the Activity Data of This PDC | [1] | ||||
| Indication | Glioblastoma | ||||
| Efficacy Data | Half Maximal Effective Concentration (EC50) |
9.0 ± 1.8 nM
|
|||
| Evaluation Method | CCK-8 assay | ||||
| Description |
Cell proliferation was quantified 4 d after treatment with 5 d or 3 using CCK-8 colorimetric assays and compared to the untreated control. Metabolic activity measured by CCK-8 was validated by quantifying celldeath using Trypan Blue.
|
||||
| In Vitro Model | Glioblastoma | U-87MG cell | CVCL_0022 | ||
EETI-2.5Z-amide -gemcitabine [Investigative]
Revealed Based on the Cell Line Data
| Experiment 1 Reporting the Activity Data of This PDC | [1] | ||||
| Indication | Glioblastoma | ||||
| Efficacy Data | Half Maximal Inhibitory Concentration (IC50) |
2.8 ± 0.2 nM
|
|||
| Evaluation Method | CCK-8 assay | ||||
| Description |
Cell proliferation was quantified 4 d after treatment with each compoundusing CCK-8 colorimetric assays and compared to the untreated control.
|
||||
| In Vitro Model | Glioblastoma | U-87MG cell | CVCL_0022 | ||
| Experiment 2 Reporting the Activity Data of This PDC | [1] | ||||
| Indication | Glioblastoma | ||||
| Efficacy Data | Half Maximal Effective Concentration (EC50) |
8.9 ± 1.2 nM
|
|||
| Evaluation Method | CCK-8 assay | ||||
| Description |
Cell proliferation was quantified 4 d after treatment with each compoundusing CCK-8 colorimetric assays and compared to the untreated control.
|
||||
| In Vitro Model | Glioblastoma | U-87MG cell | CVCL_0022 | ||
EETI-2.5Z-carbamate -gemcitabine [Investigative]
Revealed Based on the Cell Line Data
| Experiment 1 Reporting the Activity Data of This PDC | [1] | ||||
| Indication | Glioblastoma | ||||
| Efficacy Data | Half Maximal Inhibitory Concentration (IC50) |
3.3 ± 0.2 nM
|
|||
| Evaluation Method | CCK-8 assay | ||||
| Description |
Cell proliferation was quantified 4 d after treatment with each compoundusing CCK-8 colorimetric assays and compared to the untreated control.
|
||||
| In Vitro Model | Glioblastoma | U-87MG cell | CVCL_0022 | ||
| Experiment 2 Reporting the Activity Data of This PDC | [1] | ||||
| Indication | Glioblastoma | ||||
| Efficacy Data | Half Maximal Effective Concentration (EC50) | > 1000 nM | |||
| Evaluation Method | CCK-8 assay | ||||
| Description |
Cell proliferation was quantified 4 d after treatment with each compoundusing CCK-8 colorimetric assays and compared to the untreated control.
|
||||
| In Vitro Model | Glioblastoma | U-87MG cell | CVCL_0022 | ||
EETI-2.5Z-ester-gemcitabine [Investigative]
Revealed Based on the Cell Line Data
| Experiment 1 Reporting the Activity Data of This PDC | [1] | ||||
| Indication | Glioblastoma | ||||
| Efficacy Data | Half Maximal Inhibitory Concentration (IC50) |
5.2 ± 3.6 nM
|
|||
| Evaluation Method | CCK-8 assay | ||||
| Description |
Cell proliferation was quantified 4 d after treatment with each compoundusing CCK-8 colorimetric assays and compared to the untreated control.
|
||||
| In Vitro Model | Glioblastoma | U-87MG cell | CVCL_0022 | ||
| Experiment 2 Reporting the Activity Data of This PDC | [1] | ||||
| Indication | Glioblastoma | ||||
| Efficacy Data | Half Maximal Effective Concentration (EC50) |
8.5 ± 3.3 nM
|
|||
| Evaluation Method | CCK-8 assay | ||||
| Description |
Cell proliferation was quantified 4 d after treatment with each compoundusing CCK-8 colorimetric assays and compared to the untreated control.
|
||||
| In Vitro Model | Glioblastoma | U-87MG cell | CVCL_0022 | ||
References