Peptide Information
General Information of This Peptide
| Peptide ID |
PEP00127
|
|||||
|---|---|---|---|---|---|---|
| Peptide Name |
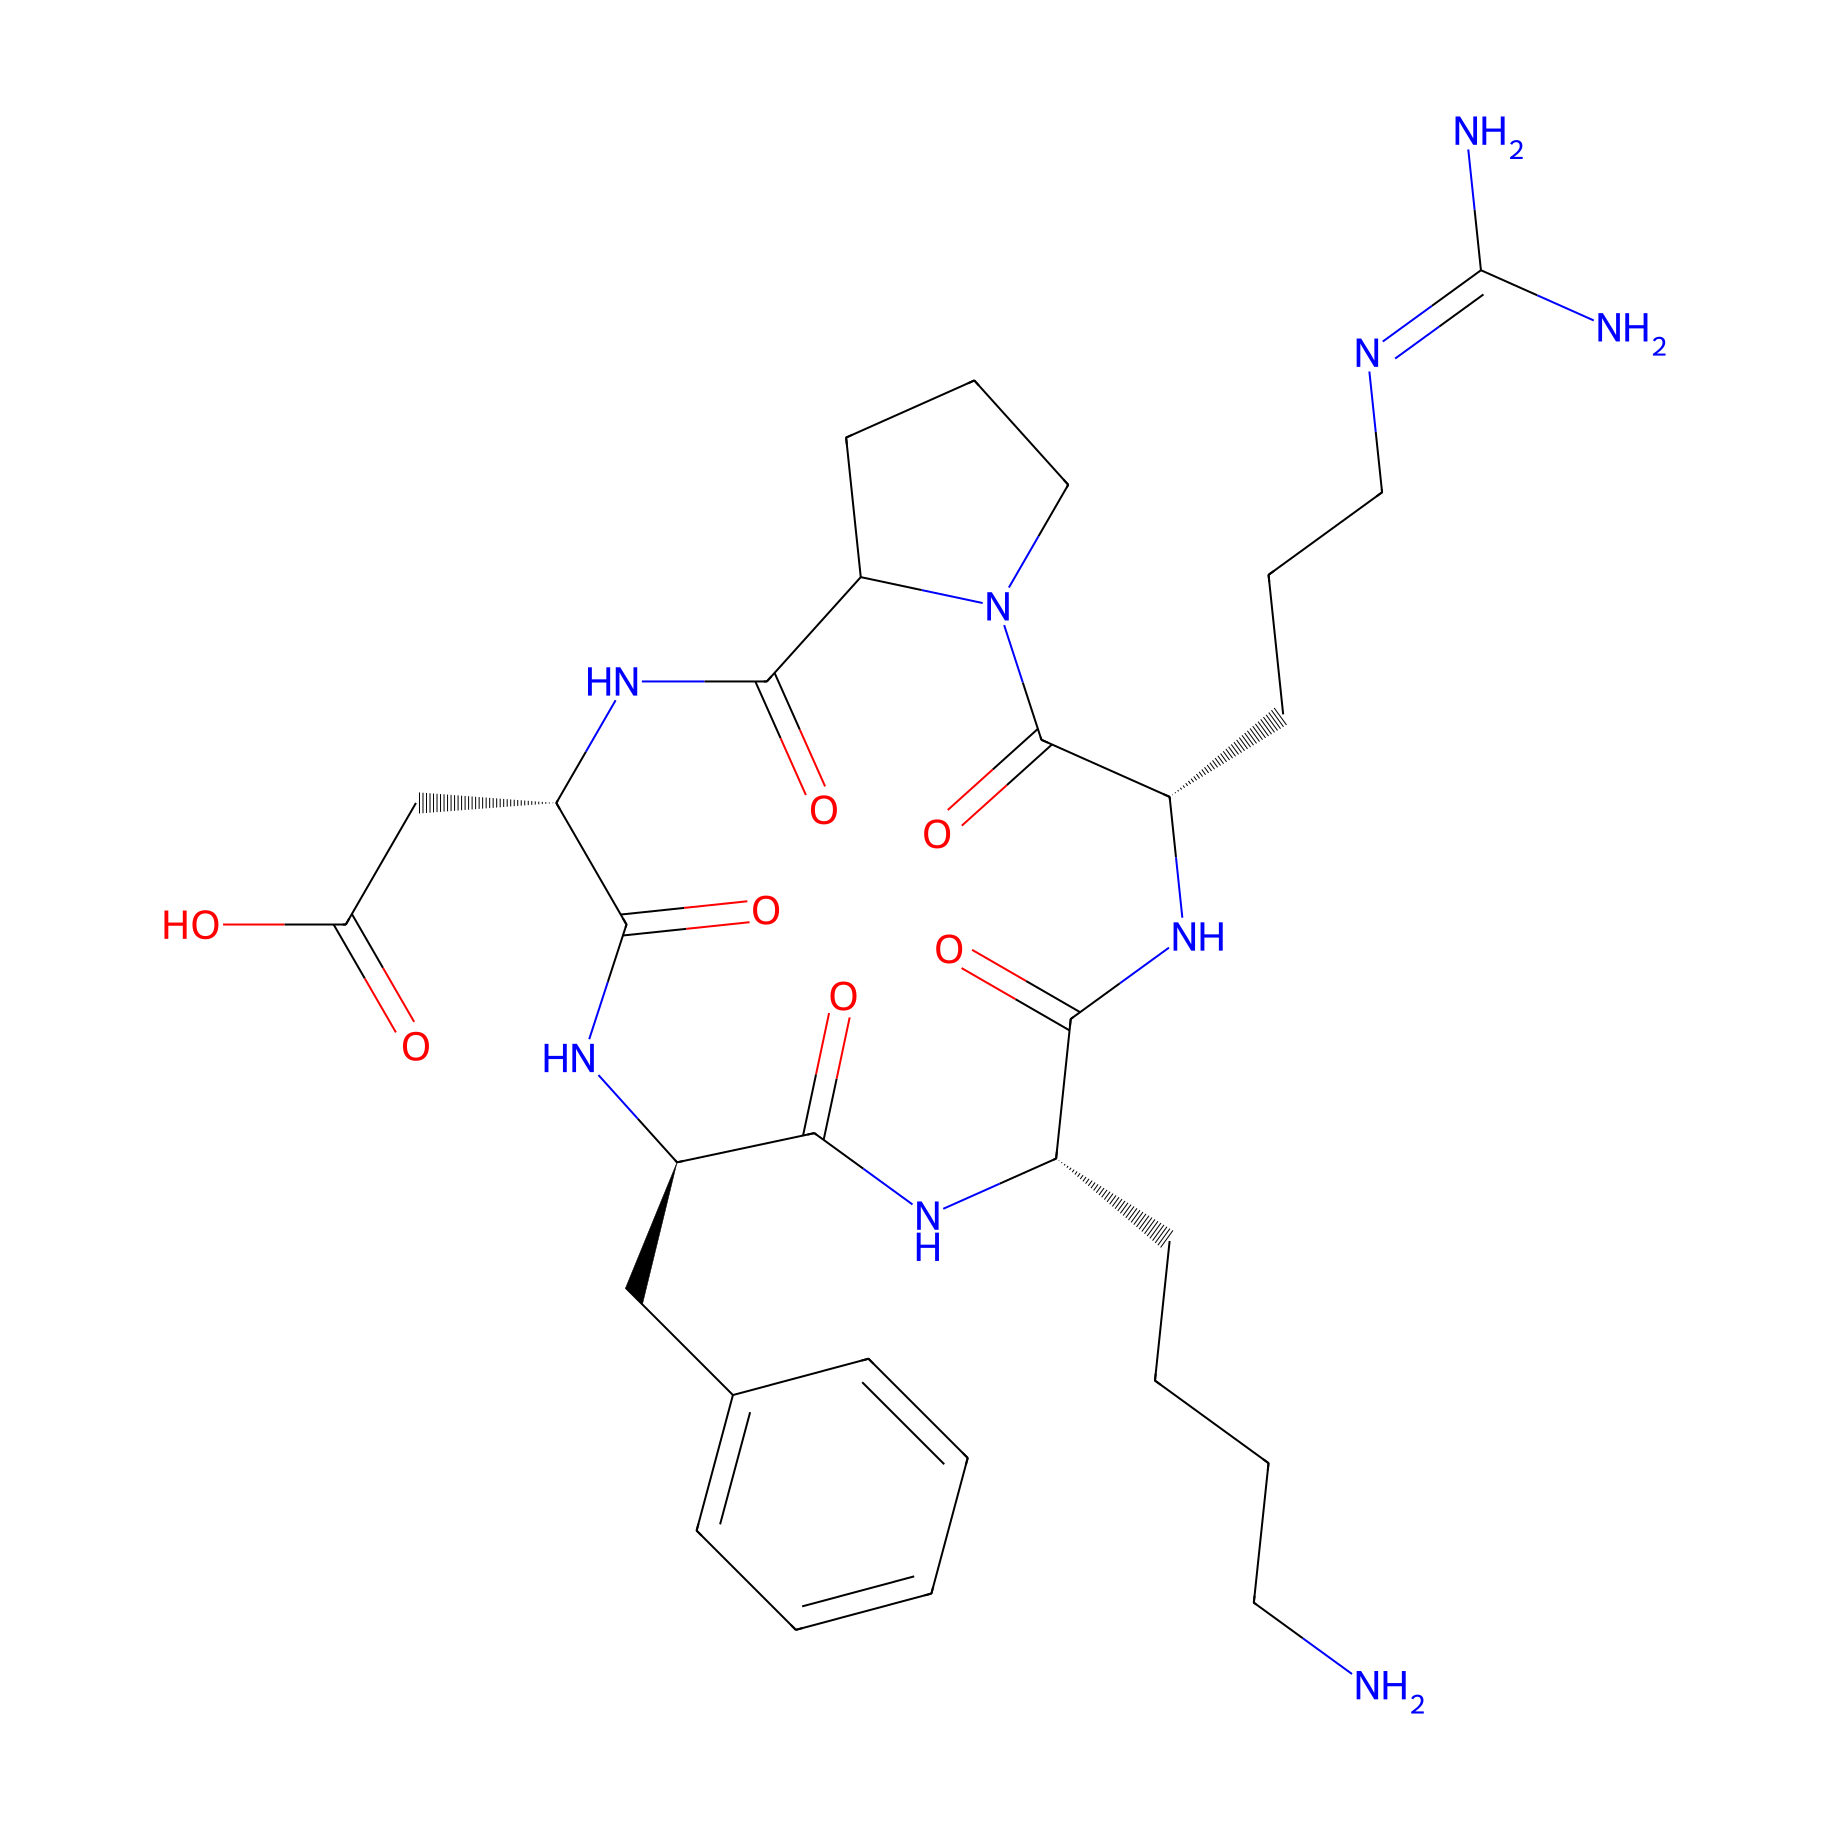
c(RPQfK)
|
|||||
| Structure |
|
|||||
| Sequence |
RPQFK
|
|||||
| Peptide Type |
Cyclic
|
|||||
| Receptor Name |
Integrin alpha-V; Integrin beta-3 (ITGAV; ITGB3)
|
Receptor Info | ||||
| PDC Transmembrane Types | Cell targeting peptides (CTPs) | |||||
| Formula |
C30H45N9O7
|
|||||
| Isosmiles |
[H]N/C(N)=N/CCC[C@@H]1NC(=O)[C@H](CCCCN)NC(=O)[C@@H](Cc2ccccc2)NC(=O)[C@H](CC(=O)O)NC(=O)C2CCCN2C1=O
|
|||||
| InChI |
InChI=1S/C30H45N9O7/c31-13-5-4-10-19-25(42)36-20(11-6-14-34-30(32)33)29(46)39-15-7-12-23(39)28(45)38-22(17-24(40)41)27(44)37-21(26(43)35-19)16-18-8-2-1-3-9-18/h1-3,8-9,19-23H,4-7,10-17,31H2,(H,35,43)(H,36,42)(H,37,44)(H,38,45)(H,40,41)(H4,32,33,34)/t19-,20-,21+,22-,23?/m0/s1
|
|||||
| InChIKey |
ISXOIHSKTMJRON-DRSFHUHJSA-N
|
|||||
| Pharmaceutical Properties |
Molecule Weight
|
643.746
|
Polar area
|
264.43
|
||
|
Complexity
|
643.3441948
|
xlogp Value
|
-2.1698
|
|||
|
Heavy Count
|
46
|
Rot Bonds
|
12
|
|||
|
Hbond acc
|
8
|
Hbond Donor
|
8
|
|||
Each Peptide-drug Conjugate Related to This Peptide
Full Information of The Activity Data of The PDC(s) Related to This Peptide
cRPQ-SMCC-DM1 [Investigative]
Discovered Using Cell Line-derived Xenograft Model
| Experiment 1 Reporting the Activity Data of This PDC | [1] | ||||
| Indication | Tumor | ||||
| Efficacy Data | Tumer volume |
2400 mm3
|
|||
| Administration Time | Given every other day for a total of five times | ||||
| Administration Dosage | 400 µg/kg (calculated by free DM1) | ||||
| Description |
It was demonstrated here, RCCD@NPs and RSSD@NPs exhibited significantly better tumor-growth inhibition compared with that of the free DM1, QCCD@NPs or QSSD@NPs (Figure (Figure4A).4A). RSSD@NPs showed the most suppression on B16 tumor up to 25 days, and resulted in a tumor volume 4 times smaller than the saline group at the end of the experiment. The final tumor volumes in various nano-DDS groups ranked from the greatest to the least: QCCD@NPs, QSSD@NPs>DM1>RCCD@NPs>RSSD@NPs. Almost the same trends were found in terms of tumor weight and tumor size (Figures (Figures4B,4B, C).
Click to Show/Hide
|
||||
Revealed Based on the Cell Line Data
| Experiment 1 Reporting the Activity Data of This PDC | [1] | ||||
| Indication | Tumor | ||||
| Efficacy Data | Half Maximal Inhibitory Concentration (IC50) |
67.61 ± 13.67 nM
|
|||
| Administration Time | 48 h | ||||
| Description |
The IC50 of QCCD@NPs and QSSD@NPs (389.05±75.25 nM and 245.47±37.54 nM) on B16 cells seemed much higher than the values of RCCD@NPs and RSSD@NPs (102.33±38.92 nM and 21.38±4.32 nM). The cytotoxicity of APDC@NPs on HUVEC showed a similar pattern.
|
||||
| In Vitro Model | Normal | Human umbilical vein endothelial cell | Homo sapiens | ||
| Experiment 2 Reporting the Activity Data of This PDC | [1] | ||||
| Indication | Tumor | ||||
| Efficacy Data | Half Maximal Inhibitory Concentration (IC50) |
331.13 ± 85.56 nM
|
|||
| Administration Time | 48 h | ||||
| Description |
The IC50 of QCCD@NPs and QSSD@NPs (389.05±75.25 nM and 245.47±37.54 nM) on B16 cells seemed much higher than the values of RCCD@NPs and RSSD@NPs (102.33±38.92 nM and 21.38±4.32 nM). The cytotoxicity of APDC@NPs on HUVEC showed a similar pattern.
|
||||
| In Vitro Model | Invasive breast carcinoma | MCF-7 cell | CVCL_0031 | ||
| Experiment 3 Reporting the Activity Data of This PDC | [1] | ||||
| Indication | Tumor | ||||
| Efficacy Data | Half Maximal Inhibitory Concentration (IC50) |
389.05 ± 75.25 nM
|
|||
| Administration Time | 48 h | ||||
| Description |
The IC50 of QCCD@NPs and QSSD@NPs (389.05±75.25 nM and 245.47±37.54 nM) on B16 cells seemed much higher than the values of RCCD@NPs and RSSD@NPs (102.33±38.92 nM and 21.38±4.32 nM). The cytotoxicity of APDC@NPs on HUVEC showed a similar pattern.
|
||||
| In Vitro Model | Melanoma | B16 cell | CVCL_F936 | ||
cRPQ-SS-DM1 [Investigative]
Discovered Using Cell Line-derived Xenograft Model
| Experiment 1 Reporting the Activity Data of This PDC | [1] | ||||
| Indication | Tumor | ||||
| Efficacy Data | Tumer volume |
5200 mm3
|
|||
| Administration Time | Given every other day for a total of five times | ||||
| Administration Dosage | 400 µg/kg (calculated by free DM1) | ||||
| Description |
It was demonstrated here, RCCD@NPs and RSSD@NPs exhibited significantly better tumor-growth inhibition compared with that of the free DM1, QCCD@NPs or QSSD@NPs (Figure (Figure4A).4A). RSSD@NPs showed the most suppression on B16 tumor up to 25 days, and resulted in a tumor volume 4 times smaller than the saline group at the end of the experiment. The final tumor volumes in various nano-DDS groups ranked from the greatest to the least: QCCD@NPs, QSSD@NPs>DM1>RCCD@NPs>RSSD@NPs. Almost the same trends were found in terms of tumor weight and tumor size (Figures (Figures4B,4B, C).
Click to Show/Hide
|
||||
Revealed Based on the Cell Line Data
| Experiment 1 Reporting the Activity Data of This PDC | [1] | ||||
| Indication | Tumor | ||||
| Efficacy Data | Half Maximal Inhibitory Concentration (IC50) |
154.88 ± 31.85 nM
|
|||
| Administration Time | 48 h | ||||
| Description |
The IC50 of QCCD@NPs and QSSD@NPs (389.05±75.25 nM and 245.47±37.54 nM) on B16 cells seemed much higher than the values of RCCD@NPs and RSSD@NPs (102.33±38.92 nM and 21.38±4.32 nM). The cytotoxicity of APDC@NPs on HUVEC showed a similar pattern.
|
||||
| In Vitro Model | Normal | Human umbilical vein endothelial cell | Homo sapiens | ||
| Experiment 2 Reporting the Activity Data of This PDC | [1] | ||||
| Indication | Tumor | ||||
| Efficacy Data | Half Maximal Inhibitory Concentration (IC50) |
245.47 ± 37.54 nM
|
|||
| Administration Time | 48 h | ||||
| Description |
The IC50 of QCCD@NPs and QSSD@NPs (389.05±75.25 nM and 245.47±37.54 nM) on B16 cells seemed much higher than the values of RCCD@NPs and RSSD@NPs (102.33±38.92 nM and 21.38±4.32 nM). The cytotoxicity of APDC@NPs on HUVEC showed a similar pattern.
|
||||
| In Vitro Model | Melanoma | B16 cell | CVCL_F936 | ||
| Experiment 3 Reporting the Activity Data of This PDC | [1] | ||||
| Indication | Tumor | ||||
| Efficacy Data | Half Maximal Inhibitory Concentration (IC50) |
371.53 ± 94.49 nM
|
|||
| Administration Time | 48 h | ||||
| Description |
The IC50 of QCCD@NPs and QSSD@NPs (389.05±75.25 nM and 245.47±37.54 nM) on B16 cells seemed much higher than the values of RCCD@NPs and RSSD@NPs (102.33±38.92 nM and 21.38±4.32 nM). The cytotoxicity of APDC@NPs on HUVEC showed a similar pattern.
|
||||
| In Vitro Model | Invasive breast carcinoma | MCF-7 cell | CVCL_0031 | ||
References