Peptide Information
General Information of This Peptide
| Peptide ID |
PEP00159
|
|||||
|---|---|---|---|---|---|---|
| Peptide Name |
[K4(C-βA-),F7,L17,P34]-hNPY
|
|||||
| Structure |
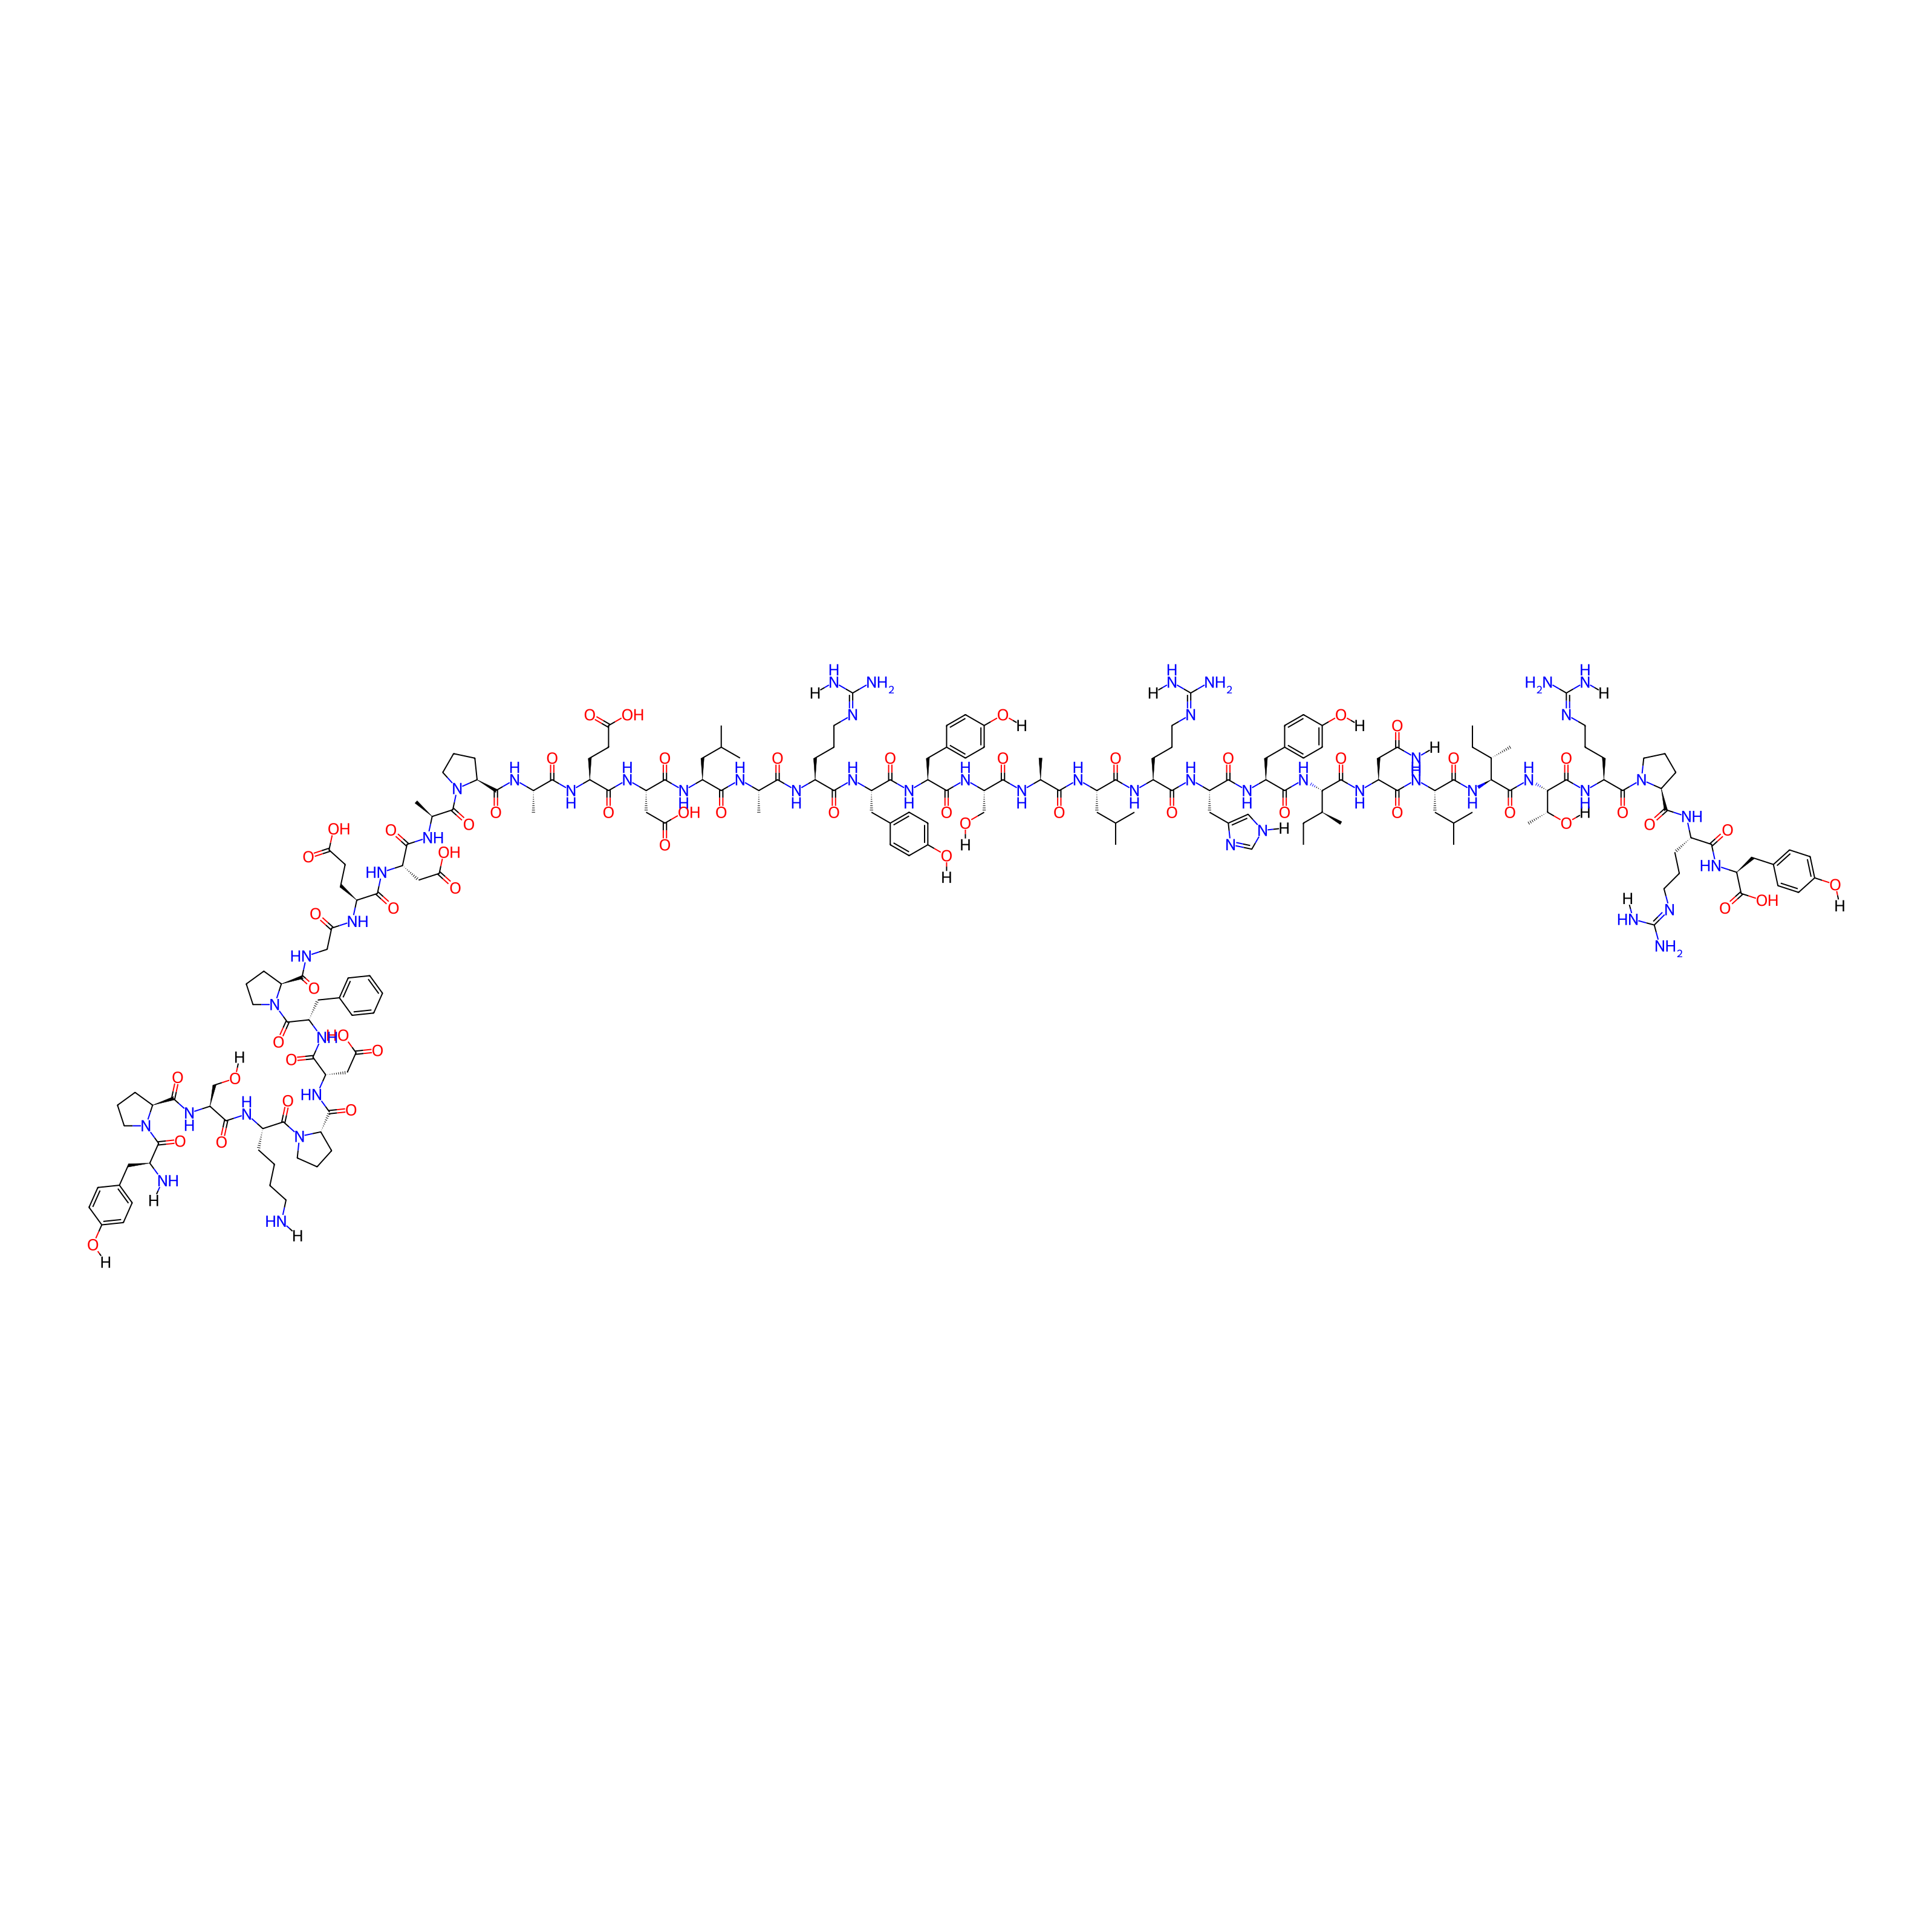
|
|||||
| Sequence |
YPSKPDFPGEDAPAEDLARYYSALRHYINLITRPRY-NH2
|
|||||
| Peptide Type |
Linear
|
|||||
| Receptor Name |
Neuropeptide Y receptor type 1 (NPY1R)
|
Receptor Info | ||||
| PDC Transmembrane Types | Cell targeting peptides (CTPs) | |||||
| Formula |
C195H288N52O56
|
|||||
| Isosmiles |
[H]NCCCC[C@H](NC(=O)[C@H](CO[H])NC(=O)[C@@H]1CCCN1C(=O)[C@H](Cc1ccc(O[H])cc1)N[H])C(=O)N1CCC[C@H]1C(=O)N[C@@H](CC(=O)O)C(=O)N[C@@H](Cc1ccccc1)C(=O)N1CCC[C@H]1C(=O)NCC(=O)N[C@@H](CCC(=O)O)C(=O)N[C@@H](CC(=O)O)C(=O)N[C@@H](C)C(=O)N1CCC[C@H]1C(=O)N[C@@H](C)C(=O)N[C@@H](CCC(=O)O)C(=O)N[C@@H](CC(=O)O)C(=O)N[C@@H](CC(C)C)C(=O)N[C@@H](C)C(=O)N[C@@H](CCC/N=C(/N)N[H])C(=O)N[C@@H](Cc1ccc(O[H])cc1)C(=O)N[C@@H](Cc1ccc(O[H])cc1)C(=O)N[C@@H](CO[H])C(=O)N[C@@H](C)C(=O)N[C@@H](CC(C)C)C(=O)N[C@@H](CCC/N=C(/N)N[H])C(=O)N[C@@H](Cc1cn([H])cn1)C(=O)N[C@@H](Cc1ccc(O[H])cc1)C(=O)N[C@]([H])(C(=O)N[C@@H](CC(=O)N[H])C(=O)N[C@@H](CC(C)C)C(=O)N[C@]([H])(C(=O)N[C@]([H])(C(=O)N[C@@H](CCC/N=C(/N)N[H])C(=O)N1CCC[C@H]1C(=O)N[C@@H](CCC/N=C(/N)N[H])C(=O)N[C@@H](Cc1ccc(O[H])cc1)C(=O)O)[C@@H](C)O[H])[C@@H](C)CC)[C@@H](C)CC
|
|||||
| InChI |
InChI=1S/C195H288N52O56/c1-16-100(9)154(183(294)235-134(88-147(198)256)171(282)227-129(80-99(7)8)174(285)241-155(101(10)17-2)184(295)242-156(106(15)250)185(296)224-126(38-26-72-211-195(205)206)189(300)246-76-30-42-145(246)180(291)222-122(37-25-71-210-194(203)204)162(273)237-139(191(302)303)86-112-52-62-118(255)63-53-112)240-175(286)132(84-111-50-60-117(254)61-51-111)230-170(281)133(87-113-92-207-96-213-113)231-161(272)121(36-24-70-209-193(201)202)221-167(278)128(79-98(5)6)225-159(270)103(12)215-176(287)140(94-248)238-169(280)131(83-110-48-58-116(253)59-49-110)229-168(279)130(82-109-46-56-115(252)57-47-109)228-160(271)120(35-23-69-208-192(199)200)219-157(268)102(11)214-165(276)127(78-97(3)4)226-172(283)136(90-152(264)265)233-164(275)124(65-67-150(260)261)220-158(269)104(13)216-179(290)143-40-28-73-243(143)186(297)105(14)217-166(277)135(89-151(262)263)232-163(274)123(64-66-149(258)259)218-148(257)93-212-178(289)142-39-27-75-245(142)190(301)138(85-107-32-19-18-20-33-107)236-173(284)137(91-153(266)267)234-181(292)146-43-31-77-247(146)188(299)125(34-21-22-68-196)223-177(288)141(95-249)239-182(293)144-41-29-74-244(144)187(298)119(197)81-108-44-54-114(251)55-45-108/h18-20,32-33,44-63,92,96-106,119-146,154-156,248-255H,16-17,21-31,34-43,64-91,93-95,196-197H2,1-15H3,(H2,198,256)(H,207,213)(H,212,289)(H,214,276)(H,215,287)(H,216,290)(H,217,277)(H,218,257)(H,219,268)(H,220,269)(H,221,278)(H,222,291)(H,223,288)(H,224,296)(H,225,270)(H,226,283)(H,227,282)(H,228,271)(H,229,279)(H,230,281)(H,231,272)(H,232,274)(H,233,275)(H,234,292)(H,235,294)(H,236,284)(H,237,273)(H,238,280)(H,239,293)(H,240,286)(H,241,285)(H,242,295)(H,258,259)(H,260,261)(H,262,263)(H,264,265)(H,266,267)(H,302,303)(H4,199,200,208)(H4,201,202,209)(H4,203,204,210)(H4,205,206,211)/t100-,101-,102-,103-,104-,105-,106+,119-,120-,121-,122-,123-,124-,125-,126-,127-,128-,129-,130-,131-,132-,133-,134-,135-,136-,137-,138-,139-,140-,141-,142-,143-,144-,145-,146-,154-,155-,156-/m0/s1
|
|||||
| InChIKey |
QSIJWQZILWJPQB-WVKITUBLSA-N
|
|||||
| Pharmaceutical Properties |
Molecule Weight
|
4256.757
|
Polar area
|
1741.6
|
||
|
Complexity
|
4254.128676
|
xlogp Value
|
-14.4733
|
|||
|
Heavy Count
|
303
|
Rot Bonds
|
137
|
|||
|
Hbond acc
|
57
|
Hbond Donor
|
56
|
|||
The Activity Data of This Peptide
| Peptide Activity Information 1 | [1] | |||||
| IC50 | 0.14 ± 0.02 nM | |||||
|---|---|---|---|---|---|---|
| Binding Affinity Assay |
Antiproliferative and cytotoxic effects, respectively, of the compounds were detected by using a fluorometric resazurin-based cell viability assay (in vitro toxicology assay kit; Sigma-Aldrich, Taufkirchen, Germany). Colon (HT-29 and Colo320), prostate (PC-3), breast cancer cell lines (MDA-MB-468 and MDA-MB-231), the chemically transformed but normal mammary gland epithelium cell line 184B5, as well as the S10 Ewing`s sarcoma family cell line SK-N-MC were seeded with low densities into 96- well plates (4,000 - 20,000 cells per well; seeding confluency &tide; 10 - 20%), and were allowed to adhere for 24 h. Subsequently, the compounds and peptide-toxin conjugate 8 - diluted to appropriate concentrations in the respective culture medium - were added to the cells. HT-29, Colo320 and PC-3 cells were treated for 72 h with tubulysin A, 2, 8 and 9. SK-N-MC, MDA-MB-468, MDA-MB-231 and 184B5 cells were initially incubated with the peptide-toxin conjugate 8 for 6 h. After that initial incubation, the incubation solution was discarded, the cells were rinsed once with cell culture medium, and subsequently were allowed to proliferate in compound-free medium until 72 h were reached. Alternatively, SK-N-MC, MDA-MB-468, MDA-MB231 and 184B5 cells were incubated for the whole experimental period of 72 h with the test items. Finally, resazurin solution in DMEM was added to yield a final resazurin concentration of 50 μM, and cells were incubated under standard growth conditions for 2 h. The conversion of resazurin to resorufin by viable, metabolically active cells was measured using a Synergy 2 multiwell plate reader (BioTek, Bad Friedrichshall, Germany) with 540 nm excitation and 590 nm emission filter setting. Non-linear regression analyses of these data was done by using GraphPad Prism software to calculate IC50 values.
Click to Show/Hide
|
|||||
| Experimental Condition | HT-29 cell | |||||
| Peptide Activity Information 2 | [1] | |||||
| IC50 | 0.23 ± 0.05 nM | |||||
| Binding Affinity Assay |
Antiproliferative and cytotoxic effects, respectively, of the compounds were detected by using a fluorometric resazurin-based cell viability assay (in vitro toxicology assay kit; Sigma-Aldrich, Taufkirchen, Germany). Colon (HT-29 and Colo320), prostate (PC-3), breast cancer cell lines (MDA-MB-468 and MDA-MB-231), the chemically transformed but normal mammary gland epithelium cell line 184B5, as well as the S10 Ewing`s sarcoma family cell line SK-N-MC were seeded with low densities into 96- well plates (4,000 - 20,000 cells per well; seeding confluency &tide; 10 - 20%), and were allowed to adhere for 24 h. Subsequently, the compounds and peptide-toxin conjugate 8 - diluted to appropriate concentrations in the respective culture medium - were added to the cells. HT-29, Colo320 and PC-3 cells were treated for 72 h with tubulysin A, 2, 8 and 9. SK-N-MC, MDA-MB-468, MDA-MB-231 and 184B5 cells were initially incubated with the peptide-toxin conjugate 8 for 6 h. After that initial incubation, the incubation solution was discarded, the cells were rinsed once with cell culture medium, and subsequently were allowed to proliferate in compound-free medium until 72 h were reached. Alternatively, SK-N-MC, MDA-MB-468, MDA-MB231 and 184B5 cells were incubated for the whole experimental period of 72 h with the test items. Finally, resazurin solution in DMEM was added to yield a final resazurin concentration of 50 μM, and cells were incubated under standard growth conditions for 2 h. The conversion of resazurin to resorufin by viable, metabolically active cells was measured using a Synergy 2 multiwell plate reader (BioTek, Bad Friedrichshall, Germany) with 540 nm excitation and 590 nm emission filter setting. Non-linear regression analyses of these data was done by using GraphPad Prism software to calculate IC50 values.
Click to Show/Hide
|
|||||
| Experimental Condition | PC-3 cell | |||||
| Peptide Activity Information 3 | [1] | |||||
| IC50 | 0.46 ± 0.05 nM | |||||
| Binding Affinity Assay |
Antiproliferative and cytotoxic effects, respectively, of the compounds were detected by using a fluorometric resazurin-based cell viability assay (in vitro toxicology assay kit; Sigma-Aldrich, Taufkirchen, Germany). Colon (HT-29 and Colo320), prostate (PC-3), breast cancer cell lines (MDA-MB-468 and MDA-MB-231), the chemically transformed but normal mammary gland epithelium cell line 184B5, as well as the S10 Ewing`s sarcoma family cell line SK-N-MC were seeded with low densities into 96- well plates (4,000 - 20,000 cells per well; seeding confluency &tide; 10 - 20%), and were allowed to adhere for 24 h. Subsequently, the compounds and peptide-toxin conjugate 8 - diluted to appropriate concentrations in the respective culture medium - were added to the cells. HT-29, Colo320 and PC-3 cells were treated for 72 h with tubulysin A, 2, 8 and 9. SK-N-MC, MDA-MB-468, MDA-MB-231 and 184B5 cells were initially incubated with the peptide-toxin conjugate 8 for 6 h. After that initial incubation, the incubation solution was discarded, the cells were rinsed once with cell culture medium, and subsequently were allowed to proliferate in compound-free medium until 72 h were reached. Alternatively, SK-N-MC, MDA-MB-468, MDA-MB231 and 184B5 cells were incubated for the whole experimental period of 72 h with the test items. Finally, resazurin solution in DMEM was added to yield a final resazurin concentration of 50 μM, and cells were incubated under standard growth conditions for 2 h. The conversion of resazurin to resorufin by viable, metabolically active cells was measured using a Synergy 2 multiwell plate reader (BioTek, Bad Friedrichshall, Germany) with 540 nm excitation and 590 nm emission filter setting. Non-linear regression analyses of these data was done by using GraphPad Prism software to calculate IC50 values.
Click to Show/Hide
|
|||||
| Experimental Condition | Colo320 cell | |||||
| Peptide Activity Information 4 | [2] | |||||
| EC50 | 0.3 nM | |||||
| Binding Affinity Assay |
The receptor activation, selectivity, and internalization were investigated to ensure that the attachment of the cleavable linker and tesa did not alter the behavior of NPY1R-preferring carrier peptide [F7, P34]-NPY. The activation of the human Y-receptors was tested using Ca2+-flux assays in COS-7 cells stably expressing one specific Y-receptor subtype (NPY1/2/4/5R) and chimeric G protein (6Gaqi4-myr), opening the Ca2+ channels upon receptor activation
Click to Show/Hide
|
|||||
| Experimental Condition | COS-7 cells | |||||
| Peptide Activity Information 5 | [2] | |||||
| EC50 | 8.5 nM | |||||
| Binding Affinity Assay |
The receptor activation, selectivity, and internalization were investigated to ensure that the attachment of the cleavable linker and tesa did not alter the behavior of NPY1R-preferring carrier peptide [F7, P34]-NPY. The activation of the human Y-receptors was tested using Ca2+-flux assays in COS-7 cells stably expressing one specific Y-receptor subtype (NPY1/2/4/5R) and chimeric G protein (6Gaqi4-myr), opening the Ca2+ channels upon receptor activation
Click to Show/Hide
|
|||||
| Experimental Condition | COS-7 cells | |||||
| Peptide Activity Information 6 | [2] | |||||
| EC50 | 32 (7.5±0.1) nM | |||||
| Binding Affinity Assay |
The receptor activation, selectivity, and internalization were investigated to ensure that the attachment of the cleavable linker and tesa did not alter the behavior of NPY1R-preferring carrier peptide [F7, P34]-NPY. The activation of the human Y-receptors was tested using Ca2+-flux assays in COS-7 cells stably expressing one specific Y-receptor subtype (NPY1/2/4/5R) and chimeric G protein (6Gaqi4-myr), opening the Ca2+ channels upon receptor activation
Click to Show/Hide
|
|||||
| Experimental Condition | COS-7 cells | |||||
Each Peptide-drug Conjugate Related to This Peptide
Full Information of The Activity Data of The PDC(s) Related to This Peptide
Tesaglitazar-[F7, P34]-NPY [Investigative]
Obtained from the Model Organism Data
| Experiment 1 Reporting the Activity Data of This PDC | [2] | ||||
| Indication | Type 2 diabetes | ||||
| Efficacy Data | Triglycerides level |
0.65
|
|||
| Administration Time | Every day; over 8 days | ||||
| Administration Dosage | 2.5 µM | ||||
| MOA of PDC |
In vitro studies revealed that the tesaglitazar-[F7, P34]-NPY conjugate selectively activates PPARγ in NPY1R-expressing cells and enhances adipocyte differentiation and adiponectin expression in adipocyte precursor cells.Additionally, tesa-NPY induces adipocyte differentiation in vivo.
|
||||
| Description |
The influence of tesa, tesa-NPY (3), and [F7, P34]-NPY (2) on the plasma lipids was also analyzed (Figure 9). The vehicle/untreated db/db mice showed elevated levels of triglycerides and free fatty acids (FFA) compared to the lean C57BL/6N mice. Treatment with tesa and tesa-NPY (3) led to a normalization of the triglycerides, FFA, whereas [F7, P34]-NPY (2) and vehicle/untreated had no influence on the lipid metabolism (Figure 9A/B). The cholesterol levels were unchanged by any treatment as these levels were also comparable in the untreated db/db mice compared to the lean mice (Figure 9C).
Click to Show/Hide
|
||||
| In Vivo Model | db/db mice model. | ||||
| Experiment 2 Reporting the Activity Data of This PDC | [2] | ||||
| Indication | Type 2 diabetes | ||||
| Efficacy Data | Triglycerides level |
0.9
|
|||
| Administration Time | Every day; over 8 days | ||||
| Administration Dosage | 2.5 µM | ||||
| MOA of PDC |
In vitro studies revealed that the tesaglitazar-[F7, P34]-NPY conjugate selectively activates PPARγ in NPY1R-expressing cells and enhances adipocyte differentiation and adiponectin expression in adipocyte precursor cells.Additionally, tesa-NPY induces adipocyte differentiation in vivo.
|
||||
| Description |
The influence of tesa, tesa-NPY (3), and [F7, P34]-NPY (2) on the plasma lipids was also analyzed (Figure 9). The vehicle/untreated db/db mice showed elevated levels of triglycerides and free fatty acids (FFA) compared to the lean C57BL/6N mice. Treatment with tesa and tesa-NPY (3) led to a normalization of the triglycerides, FFA, whereas [F7, P34]-NPY (2) and vehicle/untreated had no influence on the lipid metabolism (Figure 9A/B). The cholesterol levels were unchanged by any treatment as these levels were also comparable in the untreated db/db mice compared to the lean mice (Figure 9C).
Click to Show/Hide
|
||||
| In Vivo Model | db/db mice model. | ||||
| Experiment 3 Reporting the Activity Data of This PDC | [2] | ||||
| Indication | Type 2 diabetes | ||||
| Efficacy Data | Mcp-1 level |
305 pg/mL
|
|||
| Administration Time | Every day; over 8 days | ||||
| Administration Dosage | 2.5 µM | ||||
| MOA of PDC |
In vitro studies revealed that the tesaglitazar-[F7, P34]-NPY conjugate selectively activates PPARγ in NPY1R-expressing cells and enhances adipocyte differentiation and adiponectin expression in adipocyte precursor cells.Additionally, tesa-NPY induces adipocyte differentiation in vivo.
|
||||
| Description |
Whereas in the vehicle/untreated mice, the HbA1C values increased by approximately 2%, a graduated reduced increase was seen for [F7, P34]-NPY (2), peptide conjugate (3), and tesa (Figure 8A). Body temperature, which decreased to 35 C in the vehicle/untreated db/db controls, was normalized to 36 C in all of the treated mice including the mice treated with [F7, P34]-NPY (2) (Figure 8B). Treatment with tesa and tesa-NPY (3) led to normalization of the plasma concentration of ketone bodies and adiponectin, whereas [F7, P34]-NPY (2) and vehicle/untreated showed no effect (Figure 8C/E). Treatment had no major influence on the insulin and Mcp-1 levels (Figure 8D/G). The serum leptin concentration was reduced in the mice treated with tesa, whereas no reduction was detectable in all of the other treated mice (Figure 8F).
Click to Show/Hide
|
||||
| In Vivo Model | db/db mice model. | ||||
| Experiment 4 Reporting the Activity Data of This PDC | [2] | ||||
| Indication | Type 2 diabetes | ||||
| Efficacy Data | Leptin level |
82 ng/mL
|
|||
| Administration Time | Every day; over 8 days | ||||
| Administration Dosage | 2.5 µM | ||||
| MOA of PDC |
In vitro studies revealed that the tesaglitazar-[F7, P34]-NPY conjugate selectively activates PPARγ in NPY1R-expressing cells and enhances adipocyte differentiation and adiponectin expression in adipocyte precursor cells.Additionally, tesa-NPY induces adipocyte differentiation in vivo.
|
||||
| Description |
Whereas in the vehicle/untreated mice, the HbA1C values increased by approximately 2%, a graduated reduced increase was seen for [F7, P34]-NPY (2), peptide conjugate (3), and tesa (Figure 8A). Body temperature, which decreased to 35 C in the vehicle/untreated db/db controls, was normalized to 36 C in all of the treated mice including the mice treated with [F7, P34]-NPY (2) (Figure 8B). Treatment with tesa and tesa-NPY (3) led to normalization of the plasma concentration of ketone bodies and adiponectin, whereas [F7, P34]-NPY (2) and vehicle/untreated showed no effect (Figure 8C/E). Treatment had no major influence on the insulin and Mcp-1 levels (Figure 8D/G). The serum leptin concentration was reduced in the mice treated with tesa, whereas no reduction was detectable in all of the other treated mice (Figure 8F).
Click to Show/Hide
|
||||
| In Vivo Model | db/db mice model. | ||||
| Experiment 5 Reporting the Activity Data of This PDC | [2] | ||||
| Indication | Type 2 diabetes | ||||
| Efficacy Data | Ketone level |
0.5 mM/L
|
|||
| Administration Time | Every day; over 8 days | ||||
| Administration Dosage | 2.5 µM | ||||
| MOA of PDC |
In vitro studies revealed that the tesaglitazar-[F7, P34]-NPY conjugate selectively activates PPARγ in NPY1R-expressing cells and enhances adipocyte differentiation and adiponectin expression in adipocyte precursor cells.Additionally, tesa-NPY induces adipocyte differentiation in vivo.
|
||||
| Description |
Whereas in the vehicle/untreated mice, the HbA1C values increased by approximately 2%, a graduated reduced increase was seen for [F7, P34]-NPY (2), peptide conjugate (3), and tesa (Figure 8A). Body temperature, which decreased to 35 C in the vehicle/untreated db/db controls, was normalized to 36 C in all of the treated mice including the mice treated with [F7, P34]-NPY (2) (Figure 8B). Treatment with tesa and tesa-NPY (3) led to normalization of the plasma concentration of ketone bodies and adiponectin, whereas [F7, P34]-NPY (2) and vehicle/untreated showed no effect (Figure 8C/E). Treatment had no major influence on the insulin and Mcp-1 levels (Figure 8D/G). The serum leptin concentration was reduced in the mice treated with tesa, whereas no reduction was detectable in all of the other treated mice (Figure 8F).
Click to Show/Hide
|
||||
| In Vivo Model | db/db mice model. | ||||
| Experiment 6 Reporting the Activity Data of This PDC | [2] | ||||
| Indication | Type 2 diabetes | ||||
| Efficacy Data | Insulin level |
2 ng/mL
|
|||
| Administration Time | Every day; over 8 days | ||||
| Administration Dosage | 2.5 µM | ||||
| MOA of PDC |
In vitro studies revealed that the tesaglitazar-[F7, P34]-NPY conjugate selectively activates PPARγ in NPY1R-expressing cells and enhances adipocyte differentiation and adiponectin expression in adipocyte precursor cells.Additionally, tesa-NPY induces adipocyte differentiation in vivo.
|
||||
| Description |
Whereas in the vehicle/untreated mice, the HbA1C values increased by approximately 2%, a graduated reduced increase was seen for [F7, P34]-NPY (2), peptide conjugate (3), and tesa (Figure 8A). Body temperature, which decreased to 35 C in the vehicle/untreated db/db controls, was normalized to 36 C in all of the treated mice including the mice treated with [F7, P34]-NPY (2) (Figure 8B). Treatment with tesa and tesa-NPY (3) led to normalization of the plasma concentration of ketone bodies and adiponectin, whereas [F7, P34]-NPY (2) and vehicle/untreated showed no effect (Figure 8C/E). Treatment had no major influence on the insulin and Mcp-1 levels (Figure 8D/G). The serum leptin concentration was reduced in the mice treated with tesa, whereas no reduction was detectable in all of the other treated mice (Figure 8F).
Click to Show/Hide
|
||||
| In Vivo Model | db/db mice model. | ||||
| Experiment 7 Reporting the Activity Data of This PDC | [2] | ||||
| Indication | Type 2 diabetes | ||||
| Efficacy Data | HbA1C change |
1.05%
|
|||
| Administration Time | Every day; over 8 days | ||||
| Administration Dosage | 2.5 µM | ||||
| MOA of PDC |
In vitro studies revealed that the tesaglitazar-[F7, P34]-NPY conjugate selectively activates PPARγ in NPY1R-expressing cells and enhances adipocyte differentiation and adiponectin expression in adipocyte precursor cells.Additionally, tesa-NPY induces adipocyte differentiation in vivo.
|
||||
| Description |
Whereas in the vehicle/untreated mice, the HbA1C values increased by approximately 2%, a graduated reduced increase was seen for [F7, P34]-NPY (2), peptide conjugate (3), and tesa (Figure 8A). Body temperature, which decreased to 35 C in the vehicle/untreated db/db controls, was normalized to 36 C in all of the treated mice including the mice treated with [F7, P34]-NPY (2) (Figure 8B). Treatment with tesa and tesa-NPY (3) led to normalization of the plasma concentration of ketone bodies and adiponectin, whereas [F7, P34]-NPY (2) and vehicle/untreated showed no effect (Figure 8C/E). Treatment had no major influence on the insulin and Mcp-1 levels (Figure 8D/G). The serum leptin concentration was reduced in the mice treated with tesa, whereas no reduction was detectable in all of the other treated mice (Figure 8F).
Click to Show/Hide
|
||||
| In Vivo Model | db/db mice model. | ||||
| Experiment 8 Reporting the Activity Data of This PDC | [2] | ||||
| Indication | Type 2 diabetes | ||||
| Efficacy Data | Cholesterol level |
2.8
|
|||
| Administration Time | Every day; over 8 days | ||||
| Administration Dosage | 2.5 µM | ||||
| MOA of PDC |
In vitro studies revealed that the tesaglitazar-[F7, P34]-NPY conjugate selectively activates PPARγ in NPY1R-expressing cells and enhances adipocyte differentiation and adiponectin expression in adipocyte precursor cells.Additionally, tesa-NPY induces adipocyte differentiation in vivo.
|
||||
| Description |
The influence of tesa, tesa-NPY (3), and [F7, P34]-NPY (2) on the plasma lipids was also analyzed (Figure 9). The vehicle/untreated db/db mice showed elevated levels of triglycerides and free fatty acids (FFA) compared to the lean C57BL/6N mice. Treatment with tesa and tesa-NPY (3) led to a normalization of the triglycerides, FFA, whereas [F7, P34]-NPY (2) and vehicle/untreated had no influence on the lipid metabolism (Figure 9A/B). The cholesterol levels were unchanged by any treatment as these levels were also comparable in the untreated db/db mice compared to the lean mice (Figure 9C).
Click to Show/Hide
|
||||
| In Vivo Model | db/db mice model. | ||||
| Experiment 9 Reporting the Activity Data of This PDC | [2] | ||||
| Indication | Type 2 diabetes | ||||
| Efficacy Data | Body weigth change |
10%
|
|||
| Administration Time | Every day; over 8 days | ||||
| Administration Dosage | 2.5 µM | ||||
| Evaluation Method | Body weigth change assay | ||||
| MOA of PDC |
In vitro studies revealed that the tesaglitazar-[F7, P34]-NPY conjugate selectively activates PPARγ in NPY7R-expressing cells and enhances adipocyte differentiation and adiponectin expression in adipocyte precursor cells.Additionally, tesa-NPY induces adipocyte differentiation in vivo.
|
||||
| Description |
The mice treated with tesa and tesa-NPY (3) did not change significantly, whereas their littermates treated with [F7, P34]-NPY (2) or vehicle/untreated lost approximately 3% of their body weight (Figure 7A).
|
||||
| In Vivo Model | db/db mice model. | ||||
Tubugi-1-NPY [Investigative]
Revealed Based on the Cell Line Data
| Experiment 1 Reporting the Activity Data of This PDC | [1] | ||||
| Indication | Tumor | ||||
| Efficacy Data | Half Maximal Inhibitory Concentration (IC50) |
205 ± 49 nM
|
|||
| Description |
As shown in Table 1, the cytotoxic potency of the tubugi-1-SH was - in case of HT-29 and PC-3 - by factors 5 to 8 higher compared to the entire peptide-toxin conjugate 8. The only slight increase of cytotoxic activity of compound 9 compared to the complete conjugate 8 in Colo320 cells is most likely caused by a generally weak responsiveness of Colo320 cells towards tubugi-1-SH and the entire conjugate tubugi-1-SS-NPY. When compared with HT-29 and PC-3 cells, the IC50 value of tubugi-1-SH is by factor 10 higher in Colo320. Since the membrane passage of tubugi-1-SH is not depending on a NPY receptor, there have to be other explanations for the reduced cytotoxic impact of tubugi-1 and corresponding derivatives in Colo320, rather than the NPY Y1 receptor expression level.
Click to Show/Hide
|
||||
| In Vitro Model | Prostate carcinoma | PC-3 cell | CVCL_0035 | ||
| Experiment 2 Reporting the Activity Data of This PDC | [1] | ||||
| Indication | Tumor | ||||
| Efficacy Data | Half Maximal Inhibitory Concentration (IC50) |
452 ± 60 nM
|
|||
| Description |
As shown in Table 1, the cytotoxic potency of the tubugi-1-SH was - in case of HT-29 and PC-3 - by factors 5 to 8 higher compared to the entire peptide-toxin conjugate 8. The only slight increase of cytotoxic activity of compound 9 compared to the complete conjugate 8 in Colo320 cells is most likely caused by a generally weak responsiveness of Colo320 cells towards tubugi-1-SH and the entire conjugate tubugi-1-SS-NPY. When compared with HT-29 and PC-3 cells, the IC50 value of tubugi-1-SH is by factor 10 higher in Colo320. Since the membrane passage of tubugi-1-SH is not depending on a NPY receptor, there have to be other explanations for the reduced cytotoxic impact of tubugi-1 and corresponding derivatives in Colo320, rather than the NPY Y1 receptor expression level.
Click to Show/Hide
|
||||
| In Vitro Model | Colon cancer | HT29 cell | CVCL_A8EZ | ||
| Experiment 3 Reporting the Activity Data of This PDC | [1] | ||||
| Indication | Tumor | ||||
| Efficacy Data | Half Maximal Inhibitory Concentration (IC50) |
706 ± 185 nM
|
|||
| Description |
As shown in Table 1, the cytotoxic potency of the tubugi-1-SH was - in case of HT-29 and PC-3 - by factors 5 to 8 higher compared to the entire peptide-toxin conjugate 8. The only slight increase of cytotoxic activity of compound 9 compared to the complete conjugate 8 in Colo320 cells is most likely caused by a generally weak responsiveness of Colo320 cells towards tubugi-1-SH and the entire conjugate tubugi-1-SS-NPY. When compared with HT-29 and PC-3 cells, the IC50 value of tubugi-1-SH is by factor 10 higher in Colo320. Since the membrane passage of tubugi-1-SH is not depending on a NPY receptor, there have to be other explanations for the reduced cytotoxic impact of tubugi-1 and corresponding derivatives in Colo320, rather than the NPY Y1 receptor expression level.
Click to Show/Hide
|
||||
| In Vitro Model | Colon adenocarcinoma | COLO 320 cell | CVCL_1989 | ||
| Experiment 4 Reporting the Activity Data of This PDC | [1] | ||||
| Indication | Tumor | ||||
| Efficacy Data | Cell viability |
0%
|
|||
| Administration Time | 72 h | ||||
| Administration Dosage | 10 µM | ||||
| Description |
The 72 h treatment is more effective than the 6 h pulse treatment. Notably, in vitro antitumor activities of 8 were found to correlate very good with the hY1R expression levels, as detected by gene expression analyses using RT-qPCR. Both the cytotoxic activity and the hY1R expression level rank in the order SK-N-MC > MDA-MB-468 > MDA-MB-231 > 184B5, what proofs the hY1R-specific and -selective nature of the mode of antitumor action of the designed PDC 8. Importantly, the activity of 8 against the selected normal breast cell line 184B5 is in the same order of magnitude as for the hY1R-deficient tumor cell line (MDA-MB-231), both tested at even higher concentration of the PDC than for the Y1 cell lines.
Click to Show/Hide
|
||||
| In Vitro Model | Askin tumor | SK-N-MC cell | CVCL_0530 | ||
| Experiment 5 Reporting the Activity Data of This PDC | [1] | ||||
| Indication | Tumor | ||||
| Efficacy Data | Cell viability |
2%
|
|||
| Administration Time | 6 h | ||||
| Administration Dosage | 10 µM | ||||
| Description |
The 72 h treatment is more effective than the 6 h pulse treatment. Notably, in vitro antitumor activities of 8 were found to correlate very good with the hY1R expression levels, as detected by gene expression analyses using RT-qPCR. Both the cytotoxic activity and the hY1R expression level rank in the order SK-N-MC > MDA-MB-468 > MDA-MB-231 > 184B5, what proofs the hY1R-specific and -selective nature of the mode of antitumor action of the designed PDC 8. Importantly, the activity of 8 against the selected normal breast cell line 184B5 is in the same order of magnitude as for the hY1R-deficient tumor cell line (MDA-MB-231), both tested at even higher concentration of the PDC than for the Y1 cell lines.
Click to Show/Hide
|
||||
| In Vitro Model | Askin tumor | SK-N-MC cell | CVCL_0530 | ||
| Experiment 6 Reporting the Activity Data of This PDC | [1] | ||||
| Indication | Tumor | ||||
| Efficacy Data | Cell viability |
5%
|
|||
| Administration Time | 72 h | ||||
| Administration Dosage | 10 µM | ||||
| Description |
The 72 h treatment is more effective than the 6 h pulse treatment. Notably, in vitro antitumor activities of 8 were found to correlate very good with the hY1R expression levels, as detected by gene expression analyses using RT-qPCR. Both the cytotoxic activity and the hY1R expression level rank in the order SK-N-MC > MDA-MB-468 > MDA-MB-231 > 184B5, what proofs the hY1R-specific and -selective nature of the mode of antitumor action of the designed PDC 8. Importantly, the activity of 8 against the selected normal breast cell line 184B5 is in the same order of magnitude as for the hY1R-deficient tumor cell line (MDA-MB-231), both tested at even higher concentration of the PDC than for the Y1 cell lines.
Click to Show/Hide
|
||||
| In Vitro Model | Breast adenocarcinoma | MDA-MB-468 cell | CVCL_0419 | ||
| Experiment 7 Reporting the Activity Data of This PDC | [1] | ||||
| Indication | Tumor | ||||
| Efficacy Data | Cell viability |
10%
|
|||
| Administration Time | 6 h | ||||
| Administration Dosage | 10 µM | ||||
| Description |
The 72 h treatment is more effective than the 6 h pulse treatment. Notably, in vitro antitumor activities of 8 were found to correlate very good with the hY1R expression levels, as detected by gene expression analyses using RT-qPCR. Both the cytotoxic activity and the hY1R expression level rank in the order SK-N-MC > MDA-MB-468 > MDA-MB-231 > 184B5, what proofs the hY1R-specific and -selective nature of the mode of antitumor action of the designed PDC 8. Importantly, the activity of 8 against the selected normal breast cell line 184B5 is in the same order of magnitude as for the hY1R-deficient tumor cell line (MDA-MB-231), both tested at even higher concentration of the PDC than for the Y1 cell lines.
Click to Show/Hide
|
||||
| In Vitro Model | Breast adenocarcinoma | MDA-MB-468 cell | CVCL_0419 | ||
| Experiment 8 Reporting the Activity Data of This PDC | [1] | ||||
| Indication | Tumor | ||||
| Efficacy Data | Cell viability |
20%
|
|||
| Administration Time | 72 h | ||||
| Administration Dosage | 10 µM | ||||
| Description |
The 72 h treatment is more effective than the 6 h pulse treatment. Notably, in vitro antitumor activities of 8 were found to correlate very good with the hY1R expression levels, as detected by gene expression analyses using RT-qPCR. Both the cytotoxic activity and the hY1R expression level rank in the order SK-N-MC > MDA-MB-468 > MDA-MB-231 > 184B5, what proofs the hY1R-specific and -selective nature of the mode of antitumor action of the designed PDC 8. Importantly, the activity of 8 against the selected normal breast cell line 184B5 is in the same order of magnitude as for the hY1R-deficient tumor cell line (MDA-MB-231), both tested at even higher concentration of the PDC than for the Y1 cell lines.
Click to Show/Hide
|
||||
| In Vitro Model | Breast adenocarcinoma | MDA-MB-231 cell | CVCL_0062 | ||
| Experiment 9 Reporting the Activity Data of This PDC | [1] | ||||
| Indication | Tumor | ||||
| Efficacy Data | Cell viability |
20%
|
|||
| Administration Time | 72 h | ||||
| Administration Dosage | 10 µM | ||||
| Description |
The 72 h treatment is more effective than the 6 h pulse treatment. Notably, in vitro antitumor activities of 8 were found to correlate very good with the hY1R expression levels, as detected by gene expression analyses using RT-qPCR. Both the cytotoxic activity and the hY1R expression level rank in the order SK-N-MC > MDA-MB-468 > MDA-MB-231 > 184B5, what proofs the hY1R-specific and -selective nature of the mode of antitumor action of the designed PDC 8. Importantly, the activity of 8 against the selected normal breast cell line 184B5 is in the same order of magnitude as for the hY1R-deficient tumor cell line (MDA-MB-231), both tested at even higher concentration of the PDC than for the Y1 cell lines.
Click to Show/Hide
|
||||
| In Vitro Model | Normal | Normal mammary gland epithelium | Homo sapiens | ||
| Experiment 10 Reporting the Activity Data of This PDC | [1] | ||||
| Indication | Tumor | ||||
| Efficacy Data | Cell viability |
35%
|
|||
| Administration Time | 6 h | ||||
| Administration Dosage | 10 µM | ||||
| Description |
The 72 h treatment is more effective than the 6 h pulse treatment. Notably, in vitro antitumor activities of 8 were found to correlate very good with the hY1R expression levels, as detected by gene expression analyses using RT-qPCR. Both the cytotoxic activity and the hY1R expression level rank in the order SK-N-MC > MDA-MB-468 > MDA-MB-231 > 184B5, what proofs the hY1R-specific and -selective nature of the mode of antitumor action of the designed PDC 8. Importantly, the activity of 8 against the selected normal breast cell line 184B5 is in the same order of magnitude as for the hY1R-deficient tumor cell line (MDA-MB-231), both tested at even higher concentration of the PDC than for the Y1 cell lines.
Click to Show/Hide
|
||||
| In Vitro Model | Breast adenocarcinoma | MDA-MB-231 cell | CVCL_0062 | ||
| Experiment 11 Reporting the Activity Data of This PDC | [1] | ||||
| Indication | Tumor | ||||
| Efficacy Data | Cell viability |
50%
|
|||
| Administration Time | 6 h | ||||
| Administration Dosage | 10 µM | ||||
| Description |
The 72 h treatment is more effective than the 6 h pulse treatment. Notably, in vitro antitumor activities of 8 were found to correlate very good with the hY1R expression levels, as detected by gene expression analyses using RT-qPCR. Both the cytotoxic activity and the hY1R expression level rank in the order SK-N-MC > MDA-MB-468 > MDA-MB-231 > 184B5, what proofs the hY1R-specific and -selective nature of the mode of antitumor action of the designed PDC 8. Importantly, the activity of 8 against the selected normal breast cell line 184B5 is in the same order of magnitude as for the hY1R-deficient tumor cell line (MDA-MB-231), both tested at even higher concentration of the PDC than for the Y1 cell lines.
Click to Show/Hide
|
||||
| In Vitro Model | Normal | Normal mammary gland epithelium | Homo sapiens | ||
References