Peptide-drug Conjugate Information
General Information of This Peptide-drug Conjugate (PDC)
| PDC ID |
PDC_00097
|
|||||
|---|---|---|---|---|---|---|
| PDC Name |
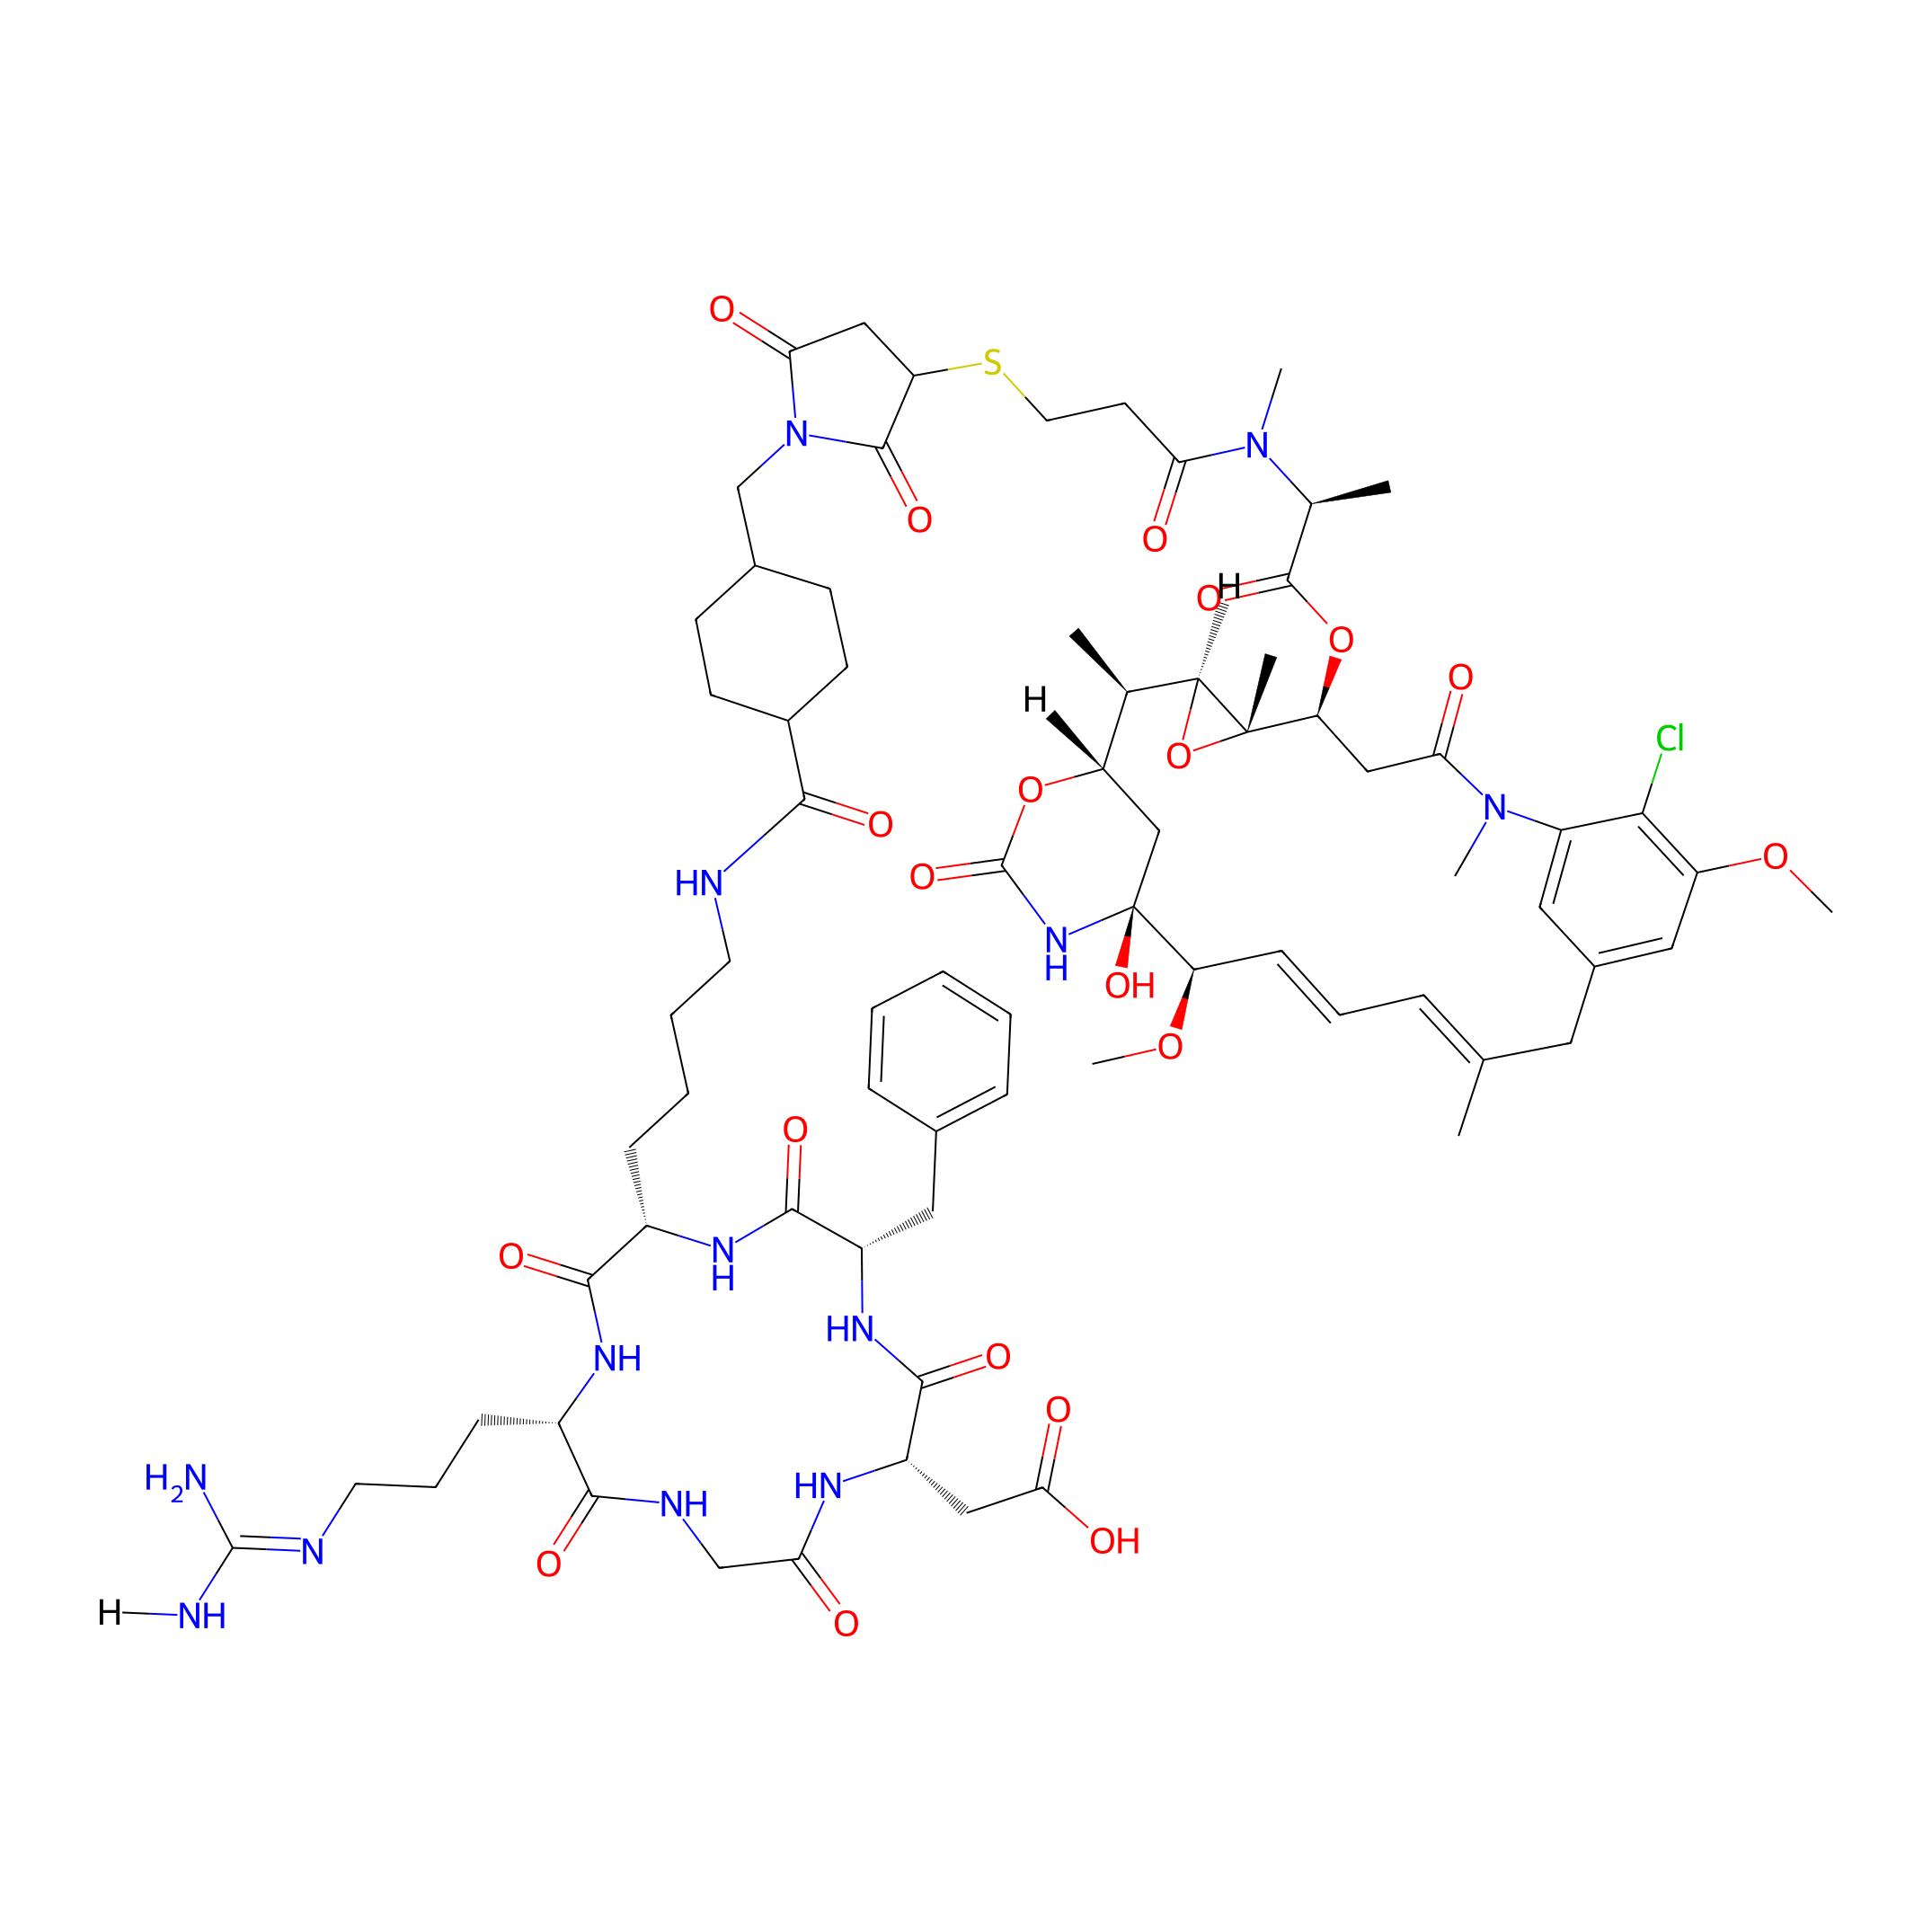
cRGD-SMCC-DM1
|
|||||
| PDC Status |
Investigative
|
|||||
| Indication |
In total 2 Indication(s)
|
|||||
| Structure |
|
|||||
| Peptide Name |
c(RGDfK)
|
Peptide Info | ||||
| Receptor Name |
Integrin alpha-V; Integrin beta-3 (ITGAV; ITGB3)
|
Receptor Info | ||||
| Drug Name |
Mertansine DM1
|
Drug Info | ||||
| Therapeutic Target |
Microtubule (MT)
|
Target Info | ||||
| Linker Name |
Sulfo-SMCC
|
Linker Info | ||||
| Peptide Modified Type |
Amino acid modifications; Cyclization modification
|
|||||
| Modified Segment |
Use D-amino acids instead of L-amino acids; Head-to-tail cyclization
|
|||||
| Formula |
C74H102ClN13O20S
|
|||||
| #Ro5 Violations (Lipinski): 4 | Molecular Weight | 1561.221 | ||||
| Lipid-water partition coefficient (xlogp) | 1.6982 | |||||
| Hydrogen Bond Donor Count (hbonddonor) | 11 | |||||
| Hydrogen Bond Acceptor Count (hbondacc) | 21 | |||||
| Rotatable Bond Count (rotbonds) | 25 | |||||
Full List of Activity Data of This Peptide-drug Conjugate
Obtained from the Model Organism Data
| Experiment 1 Reporting the Activity Data of This PDC | [1] | ||||
| Indication | Breast cancer | ||||
| Efficacy Data | ALP level |
80
|
|||
| Administration Time | 21d | ||||
| Description |
Remarkably, leucopenia and myelosuppression did not occur during the use of PDC. In addition, the values of alanine aminotransferase (ALT), aspartate aminotransferase (AST), and alkaline phosphatase (ALP), as the biomarkers of hepatic function, were all in the normal range in comparison to the saline group (Figure 5F-H). Meanwhile, normal renal function was also identified after treatment by monitoring CREA, UA, and BUN (Figure 5I-K).
Click to Show/Hide
|
||||
| In Vivo Model | Tumor-bearing nude mice. | ||||
| Experiment 2 Reporting the Activity Data of This PDC | [1] | ||||
| Indication | Breast cancer | ||||
| Efficacy Data | ALT level |
60
|
|||
| Administration Time | 21d | ||||
| Description |
Remarkably, leucopenia and myelosuppression did not occur during the use of PDC. In addition, the values of alanine aminotransferase (ALT), aspartate aminotransferase (AST), and alkaline phosphatase (ALP), as the biomarkers of hepatic function, were all in the normal range in comparison to the saline group (Figure 5F-H). Meanwhile, normal renal function was also identified after treatment by monitoring CREA, UA, and BUN (Figure 5I-K).
Click to Show/Hide
|
||||
| In Vivo Model | Tumor-bearing nude mice. | ||||
| Experiment 3 Reporting the Activity Data of This PDC | [1] | ||||
| Indication | Breast cancer | ||||
| Efficacy Data | AST level |
175
|
|||
| Administration Time | 21d | ||||
| Description |
Remarkably, leucopenia and myelosuppression did not occur during the use of PDC. In addition, the values of alanine aminotransferase (ALT), aspartate aminotransferase (AST), and alkaline phosphatase (ALP), as the biomarkers of hepatic function, were all in the normal range in comparison to the saline group (Figure 5F-H). Meanwhile, normal renal function was also identified after treatment by monitoring CREA, UA, and BUN (Figure 5I-K).
Click to Show/Hide
|
||||
| In Vivo Model | Tumor-bearing nude mice. | ||||
| Experiment 4 Reporting the Activity Data of This PDC | [1] | ||||
| Indication | Breast cancer | ||||
| Efficacy Data | BUN level |
7
|
|||
| Administration Time | 21d | ||||
| Description |
Remarkably, leucopenia and myelosuppression did not occur during the use of PDC. In addition, the values of alanine aminotransferase (ALT), aspartate aminotransferase (AST), and alkaline phosphatase (ALP), as the biomarkers of hepatic function, were all in the normal range in comparison to the saline group (Figure 5F-H). Meanwhile, normal renal function was also identified after treatment by monitoring CREA, UA, and BUN (Figure 5I-K).
Click to Show/Hide
|
||||
| In Vivo Model | Tumor-bearing nude mice. | ||||
| Experiment 5 Reporting the Activity Data of This PDC | [1] | ||||
| Indication | Breast cancer | ||||
| Efficacy Data | Tumer volume |
1000 mm3
|
|||
| Administration Time | 21d | ||||
| In Vivo Model | Tumor-bearing nude mice. | ||||
| Experiment 6 Reporting the Activity Data of This PDC | [2] | ||||
| Indication | Tumor | ||||
| Efficacy Data | Tumer volume |
2100 mm3
|
|||
| Administration Time | Given every other day for a total of five times | ||||
| Administration Dosage | 400 µg/kg (calculated by free DM1) | ||||
| Description |
It was demonstrated here, RCCD@NPs and RSSD@NPs exhibited significantly better tumor-growth inhibition compared with that of the free DM1, QCCD@NPs or QSSD@NPs (Figure (Figure4A).4A). RSSD@NPs showed the most suppression on B16 tumor up to 25 days, and resulted in a tumor volume 4 times smaller than the saline group at the end of the experiment. The final tumor volumes in various nano-DDS groups ranked from the greatest to the least: QCCD@NPs, QSSD@NPs>DM1>RCCD@NPs>RSSD@NPs. Almost the same trends were found in terms of tumor weight and tumor size (Figures (Figures4B,4B, C).
Click to Show/Hide
|
||||
| In Vivo Model | Tumor-bearing C57BL/6 mice model. | ||||
| Experiment 7 Reporting the Activity Data of This PDC | [1] | ||||
| Indication | Breast cancer | ||||
| Efficacy Data | Uric acid levels |
185
|
|||
| Administration Time | 21d | ||||
| Description |
Remarkably, leucopenia and myelosuppression did not occur during the use of PDC. In addition, the values of alanine aminotransferase (ALT), aspartate aminotransferase (AST), and alkaline phosphatase (ALP), as the biomarkers of hepatic function, were all in the normal range in comparison to the saline group (Figure 5F-H). Meanwhile, normal renal function was also identified after treatment by monitoring CREA, UA, and BUN (Figure 5I-K).
Click to Show/Hide
|
||||
| In Vivo Model | Tumor-bearing nude mice. | ||||
Revealed Based on the Cell Line Data
| Experiment 1 Reporting the Activity Data of This PDC | [2] | ||||
| Indication | Tumor | ||||
| Efficacy Data | Half Maximal Inhibitory Concentration (IC50) |
33.84 ± 6.30 nM
|
|||
| Administration Time | 48 h | ||||
| Description |
The IC50 of QCCD@NPs and QSSD@NPs (389.05±75.25 nM and 245.47±37.54 nM) on B16 cells seemed much higher than the values of RCCD@NPs and RSSD@NPs (102.33±38.92 nM and 21.38±4.32 nM). The cytotoxicity of APDC@NPs on HUVEC showed a similar pattern.
|
||||
| In Vitro Model | Normal | Human umbilical vein endothelial cell | Homo sapiens | ||
| Experiment 2 Reporting the Activity Data of This PDC | [1] | ||||
| Indication | Breast cancer | ||||
| Efficacy Data | Half Maximal Inhibitory Concentration (IC50) |
68.5 nM
|
|||
| Description |
After the MDA-MB-231 cell line was confirmed to be integrin v3-positive by immunofluorescence assay, it was demonstrated that cRGD-SMCC-DM1 had an IC50 value of 68.5 nM to MDA-MB-231 cells.
|
||||
| In Vitro Model | Breast adenocarcinoma | MDA-MB-231 cell | CVCL_0062 | ||
| Experiment 3 Reporting the Activity Data of This PDC | [2] | ||||
| Indication | Tumor | ||||
| Efficacy Data | Half Maximal Inhibitory Concentration (IC50) |
102.33 ± 38.92 nM
|
|||
| Administration Time | 48 h | ||||
| Description |
The IC50 of QCCD@NPs and QSSD@NPs (389.05±75.25 nM and 245.47±37.54 nM) on B16 cells seemed much higher than the values of RCCD@NPs and RSSD@NPs (102.33±38.92 nM and 21.38±4.32 nM). The cytotoxicity of APDC@NPs on HUVEC showed a similar pattern.
|
||||
| In Vitro Model | Melanoma | B16 cell | CVCL_F936 | ||
| Experiment 4 Reporting the Activity Data of This PDC | [2] | ||||
| Indication | Tumor | ||||
| Efficacy Data | Half Maximal Inhibitory Concentration (IC50) |
407.38 ± 54.05 nM
|
|||
| Administration Time | 48 h | ||||
| Description |
The IC50 of QCCD@NPs and QSSD@NPs (389.05±75.25 nM and 245.47±37.54 nM) on B16 cells seemed much higher than the values of RCCD@NPs and RSSD@NPs (102.33±38.92 nM and 21.38±4.32 nM). The cytotoxicity of APDC@NPs on HUVEC showed a similar pattern.
|
||||
| In Vitro Model | Invasive breast carcinoma | MCF-7 cell | CVCL_0031 | ||
References