Peptide-drug Conjugate Information
General Information of This Peptide-drug Conjugate (PDC)
| PDC ID |
PDC_00099
|
|||||
|---|---|---|---|---|---|---|
| PDC Name |
cRGD-SS-DM1
|
|||||
| PDC Status |
Investigative
|
|||||
| Indication |
In total 1 Indication(s)
|
|||||
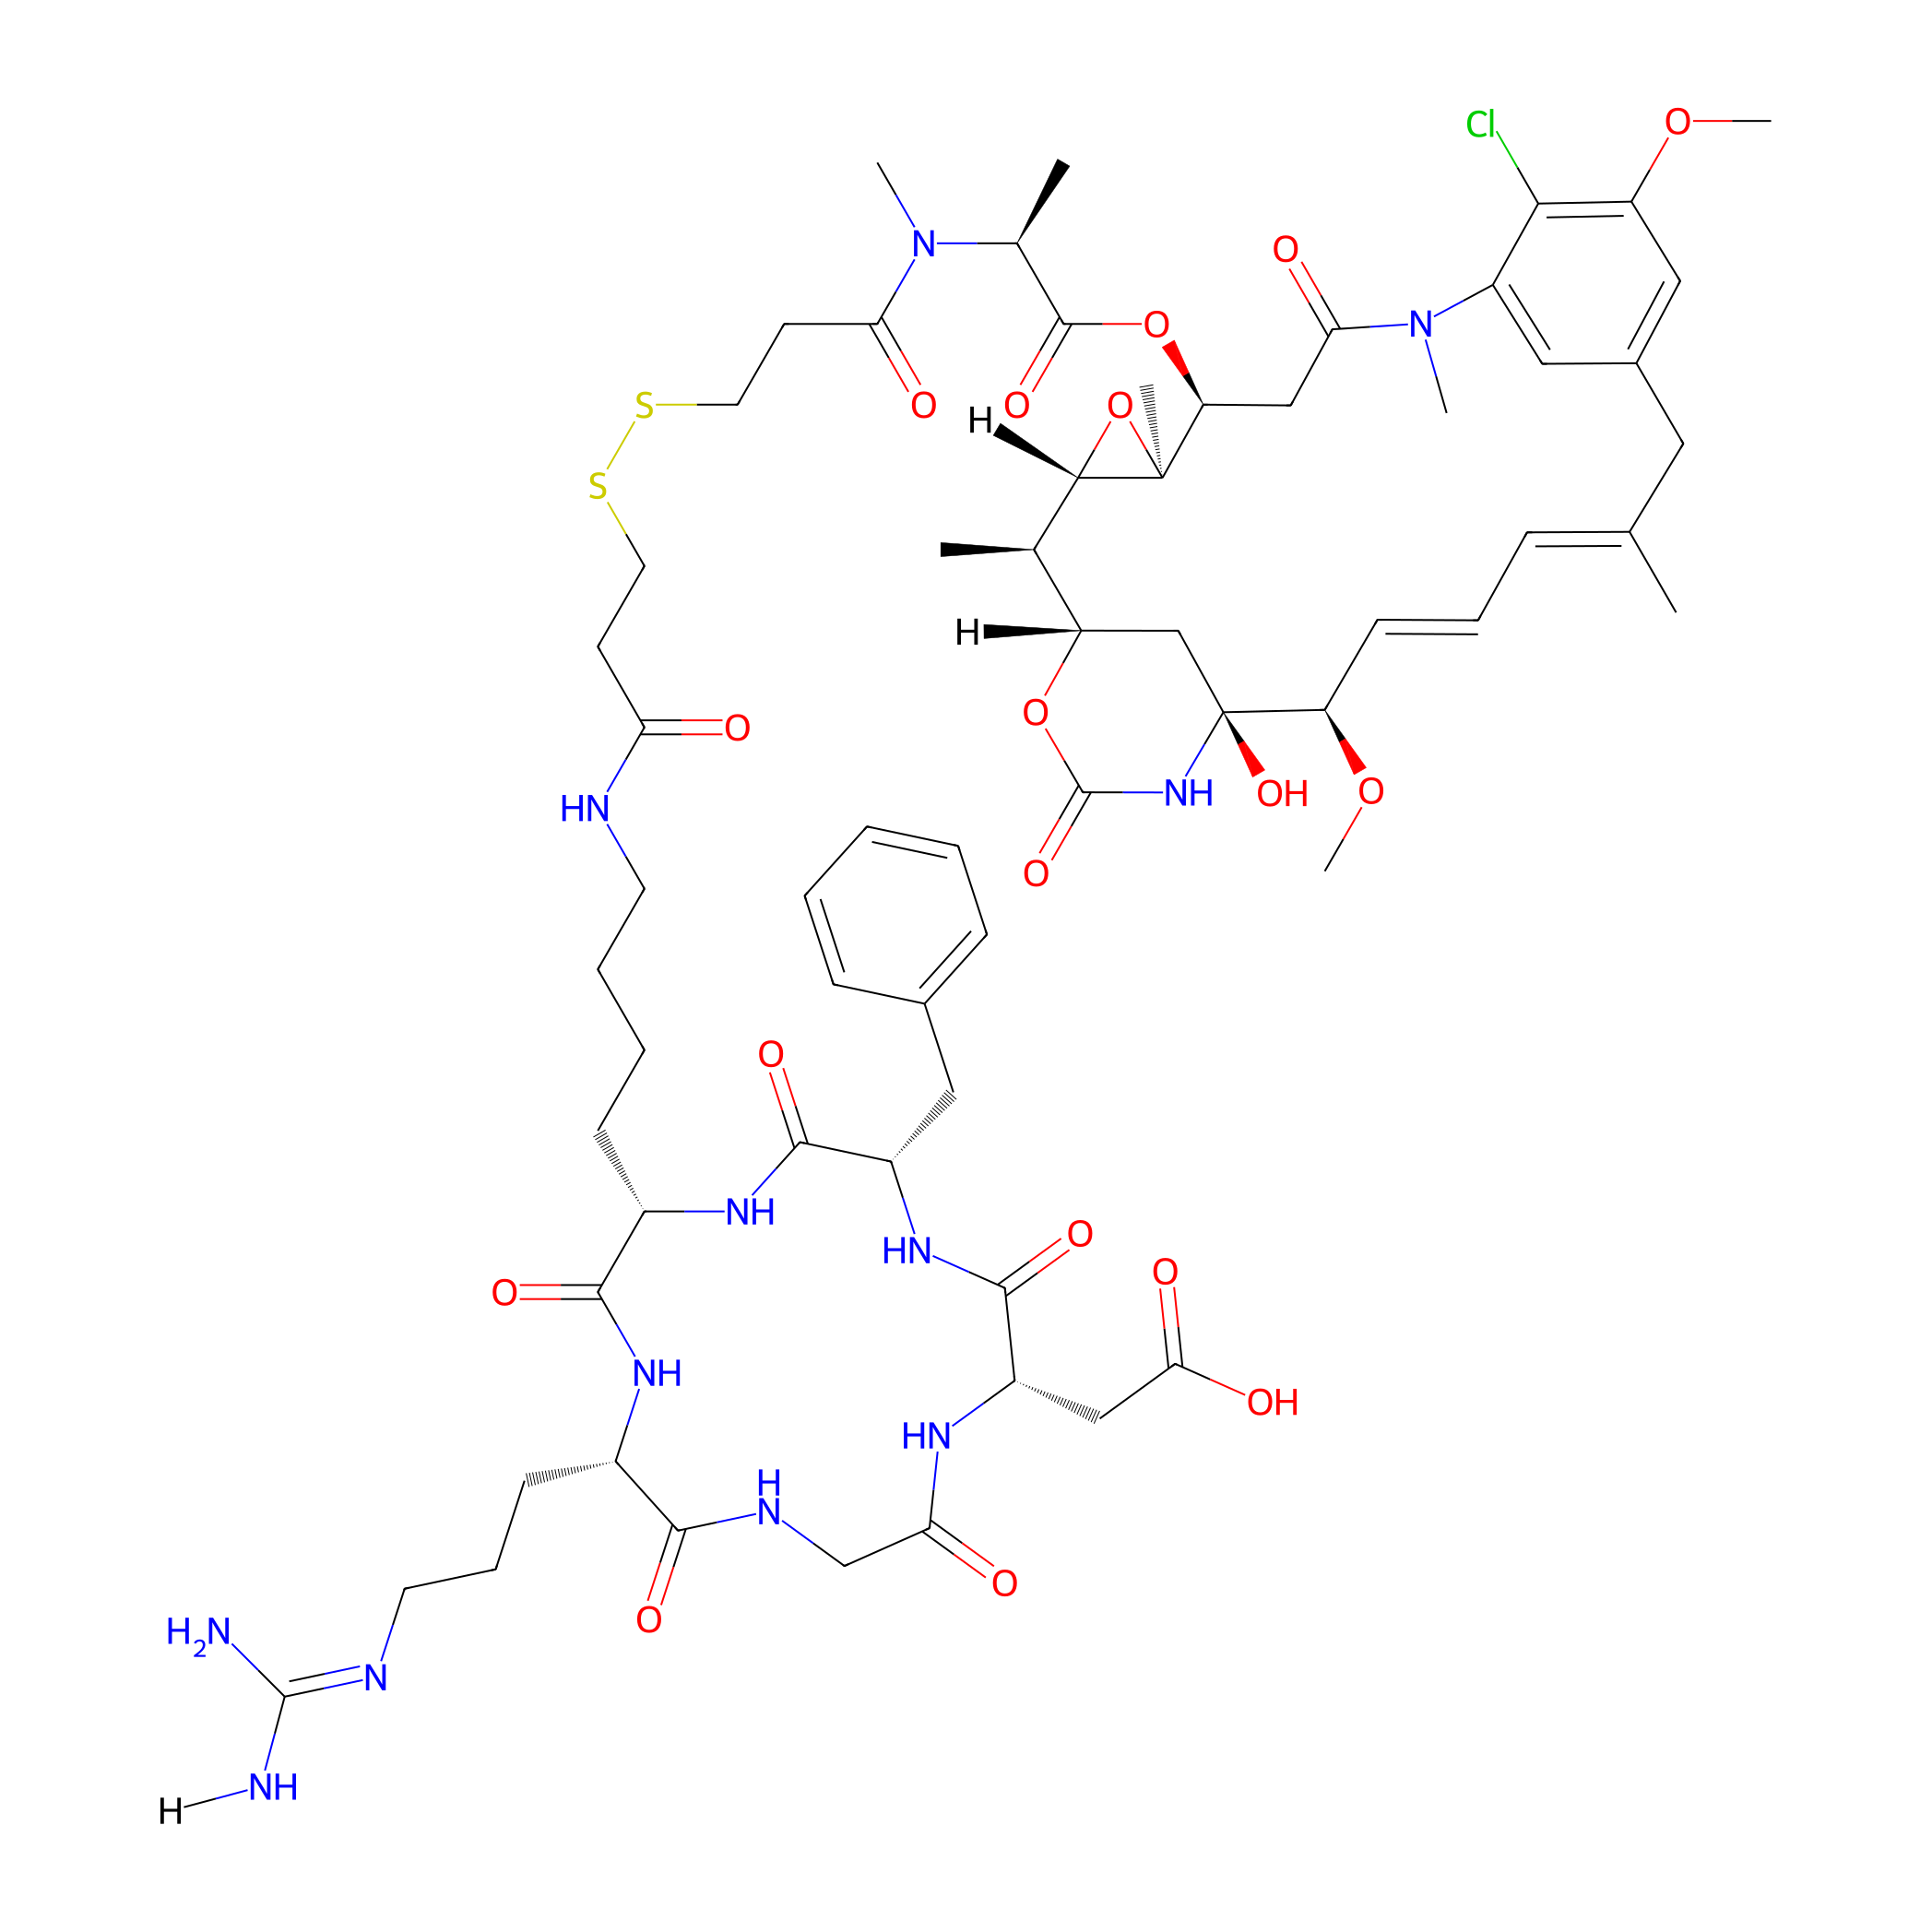
| Structure |
|
|||||
| Peptide Name |
c(RGDfK)
|
Peptide Info | ||||
| Receptor Name |
Integrin alpha-V; Integrin beta-3 (ITGAV; ITGB3)
|
Receptor Info | ||||
| Drug Name |
Mertansine DM1
|
Drug Info | ||||
| Therapeutic Target |
Microtubule (MT)
|
Target Info | ||||
| Linker Name |
Disulfide bond
|
Linker Info | ||||
| Peptide Modified Type |
Cyclization modification
|
|||||
| Formula |
C65H91ClN12O18S2
|
|||||
| #Ro5 Violations (Lipinski): 4 | Molecular Weight | 1428.096 | ||||
| Lipid-water partition coefficient (xlogp) | 1.8026 | |||||
| Hydrogen Bond Donor Count (hbonddonor) | 11 | |||||
| Hydrogen Bond Acceptor Count (hbondacc) | 20 | |||||
| Rotatable Bond Count (rotbonds) | 25 | |||||
Full List of Activity Data of This Peptide-drug Conjugate
Discovered Using Cell Line-derived Xenograft Model
| Experiment 1 Reporting the Activity Data of This PDC | [1] | ||||
| Indication | Tumor | ||||
| Efficacy Data | Tumer volume |
1800 mm3
|
|||
| Administration Time | Given every other day for a total of five times | ||||
| Administration Dosage | 400 µg/kg (calculated by free DM1) | ||||
| Description |
It was demonstrated here, RCCD@NPs and RSSD@NPs exhibited significantly better tumor-growth inhibition compared with that of the free DM1, QCCD@NPs or QSSD@NPs (Figure (Figure4A).4A). RSSD@NPs showed the most suppression on B16 tumor up to 25 days, and resulted in a tumor volume 4 times smaller than the saline group at the end of the experiment. The final tumor volumes in various nano-DDS groups ranked from the greatest to the least: QCCD@NPs, QSSD@NPs>DM1>RCCD@NPs>RSSD@NPs. Almost the same trends were found in terms of tumor weight and tumor size (Figures (Figures4B,4B, C).
Click to Show/Hide
|
||||
Revealed Based on the Cell Line Data
| Experiment 1 Reporting the Activity Data of This PDC | [1] | ||||
| Indication | Tumor | ||||
| Efficacy Data | Half Maximal Inhibitory Concentration (IC50) |
20.42 ± 4.70 nM
|
|||
| Administration Time | 48 h | ||||
| Description |
The IC50 of QCCD@NPs and QSSD@NPs (389.05±75.25 nM and 245.47±37.54 nM) on B16 cells seemed much higher than the values of RCCD@NPs and RSSD@NPs (102.33±38.92 nM and 21.38±4.32 nM). The cytotoxicity of APDC@NPs on HUVEC showed a similar pattern.
|
||||
| In Vitro Model | Normal | Human umbilical vein endothelial cell | Homo sapiens | ||
| Experiment 2 Reporting the Activity Data of This PDC | [1] | ||||
| Indication | Tumor | ||||
| Efficacy Data | Half Maximal Inhibitory Concentration (IC50) |
21.38 ± 4.32 nM
|
|||
| Administration Time | 48 h | ||||
| Description |
The IC50 of QCCD@NPs and QSSD@NPs (389.05±75.25 nM and 245.47±37.54 nM) on B16 cells seemed much higher than the values of RCCD@NPs and RSSD@NPs (102.33±38.92 nM and 21.38±4.32 nM). The cytotoxicity of APDC@NPs on HUVEC showed a similar pattern.
|
||||
| In Vitro Model | Melanoma | B16 cell | CVCL_F936 | ||
| Experiment 3 Reporting the Activity Data of This PDC | [1] | ||||
| Indication | Tumor | ||||
| Efficacy Data | Half Maximal Inhibitory Concentration (IC50) |
302.00 ± 72.91 nM
|
|||
| Administration Time | 48 h | ||||
| Description |
The IC50 of QCCD@NPs and QSSD@NPs (389.05±75.25 nM and 245.47±37.54 nM) on B16 cells seemed much higher than the values of RCCD@NPs and RSSD@NPs (102.33±38.92 nM and 21.38±4.32 nM). The cytotoxicity of APDC@NPs on HUVEC showed a similar pattern.
|
||||
| In Vitro Model | Invasive breast carcinoma | MCF-7 cell | CVCL_0031 | ||
References